


Seasonal patterns of lotic water mite assemblages
Stenger, Logan R.  1
; Ferguson, Francesca M.
2
and Skvarla, Michael J.
3
1
; Ferguson, Francesca M.
2
and Skvarla, Michael J.
3
1✉ The Pennsylvania State University, Department of Entomology, University Park, Pennsylvania, U.S.A.
2The Pennsylvania State University, Huck Institute of the Life Sciences, University Park, Pennsylvania, U.S.A.
3The Pennsylvania State University, Department of Entomology, University Park, Pennsylvania, U.S.A.
2025 - Volume: 65 Issue: 3 pages: 917-926
https://doi.org/10.24349/aixr-puzvOriginal research
Keywords
Abstract
Introduction
Until the last few decades, water mites (Acari: Hydrachnidia) have been notoriously understudied. Once thought to be rare or uncommon in aquatic ecosystems, we now recognize that water mites are one of the most diverse and widely distributed groups of aquatic invertebrates on the planet. Current taxonomic studies have recognized more than 7,500 species worldwide, representing more than 400 genera, 56 families, and 7 superfamilies, with estimates that another 4,000 species have yet to be discovered (Di Sabatino et al. 2008; Smit 2020). In addition, water mites have been documented in nearly every known lentic or lotic freshwater environment around the world, and in some instances can be quite abundant (Di Sabatino et al. 2008). In lotic systems, water mites are commonly found in fast-flowing, riffle run stream habitats where one square meter of substrate can contain as many as 5,000 individual mites representing more than 50 species, 30 genera, and all 7 superfamilies (Smith et al. 2010).
Due to their diversity and ubiquity, there has been interest as to whether water mites can be used as bioindicators of water quality conditions similar to other diverse and commonly collected aquatic invertebrates. While these examinations date back to the early 20th century (Miccoli et al. 2013), this topic has become a more prominent focus in water mite research since the early 1990s (Gerecke and Schwoerbel 1991) and in the last thirty years studies examining the utility of water mites as bioindicators have been conducted in lentic and lotic environments across the globe (Gerecke and Schwoerbel 1991; Growns 2001; Cicolani et al. 2009; Goldschmidt 2009; Cîmpean 2010; Miccoli et al. 2013; Goldschmidt et al. 2016; Zawal et al. 2017; Vasquez et al. 2022; Gurung et al. 2022; Stenger et al. 2024). To summarize their findings, the consensus is that water mite assemblages can be used as bioindicators to differentiate between polluted and unpolluted aquatic resources. These studies showed that, similar to certain groups of benthic macroinvertebrates, water mites become less dominant or completely absent in streams with poor water quality conditions, indicating mites are likely sensitive to pollution and especially useful as bioindicators. Thus, acarologists are exploring ways to integrate water mites into biomonitoring strategies (Smith et al. 2010; Goldschmidt 2016).
However, while acarologists have recognized the utility of water mites as bioindicators, most state and national biomonitoring protocols currently ignore water mites completely or collectively identify water mites as ''Hydracarina» or ''Hydrachnidia″, an artificial grouping of several water mite superfamilies, and fail to account for their immense diversity (Goldschmidt 2016; Shull 2021). While this neglect is primarily attributed to cultural precedent (Goldschmidt 2016), historical misperceptions lead people to believe that water mites are rare or too difficult to collect and identify (Growns 2001). Although many studies have shown these assumptions to be false (Smith et al. 2010; Stenger and Skvarla 2022), it is important to continue to develop efficient, cost-effective, and easy to use collection and assessment protocols to further encourage the widespread inclusion of water mites in biomonitoring efforts.
For these new protocols to provide meaningful information, it is important to consider several ecological characteristics while developing assessment methods. For example, many protocols restrict sampling efforts to specific times of year to ensure target macroinvertebrates are readily abundant and mature so that accurate identifications are possible. This also ensures that benthic macroinvertebrate communities are comparable when examining multiple sites across streams or rivers. In Pennsylvania, USA, the preferred benthic macroinvertebrate bioassessment window runs from November through May because a large proportion of macroinvertebrates reach maturity during this timeframe and emerge as terrestrial adults in late spring and early summer (Chalfant 2021). While samples can still be collected outside of this window (June through October), the offspring of the recently emerged invertebrates are small and underdeveloped, making collection and identification more difficult (Chalfant 2021). As a result, samples collected in the October-June timeframe can sometimes falsely indicate low diversity, and thus portray poor water quality conditions, by failing to account for the presence of the small, underdeveloped individuals of various taxa. Similar consideration needs to be taken to determine the best time of year to collect water mites.
However, few quantitative studies have examined how water mite populations vary across seasons (Meyer 1994). Two studies from Germany have found that while water mites can be collected throughout the year, their abundance is typically lowest during the winter months and highest during the summer months (Meyer 1994; Gerecke 2002). If this holds true for water mite populations in Pennsylvania, which is likely translatable to much of the eastern USA, this could provide an additional window for biomonitoring assessments that current benthic macroinvertebrate protocols tend to avoid. Here, we provide a detailed examination of year-round variation in water mite communities.
Methods
Water Mite Collection
With a few exceptions, we collected water mites every other month across nine different lotic, riffle-run sites between 1 August 2021 – 31 August 2022 (Figure 1). Hazardous high flow and ice conditions prevented sampling at one site during December 2021 and at all sites in February 2022. This resulted in approximately six samples per site (except for one site that had only five) for a combined total of 53 water mite samples.
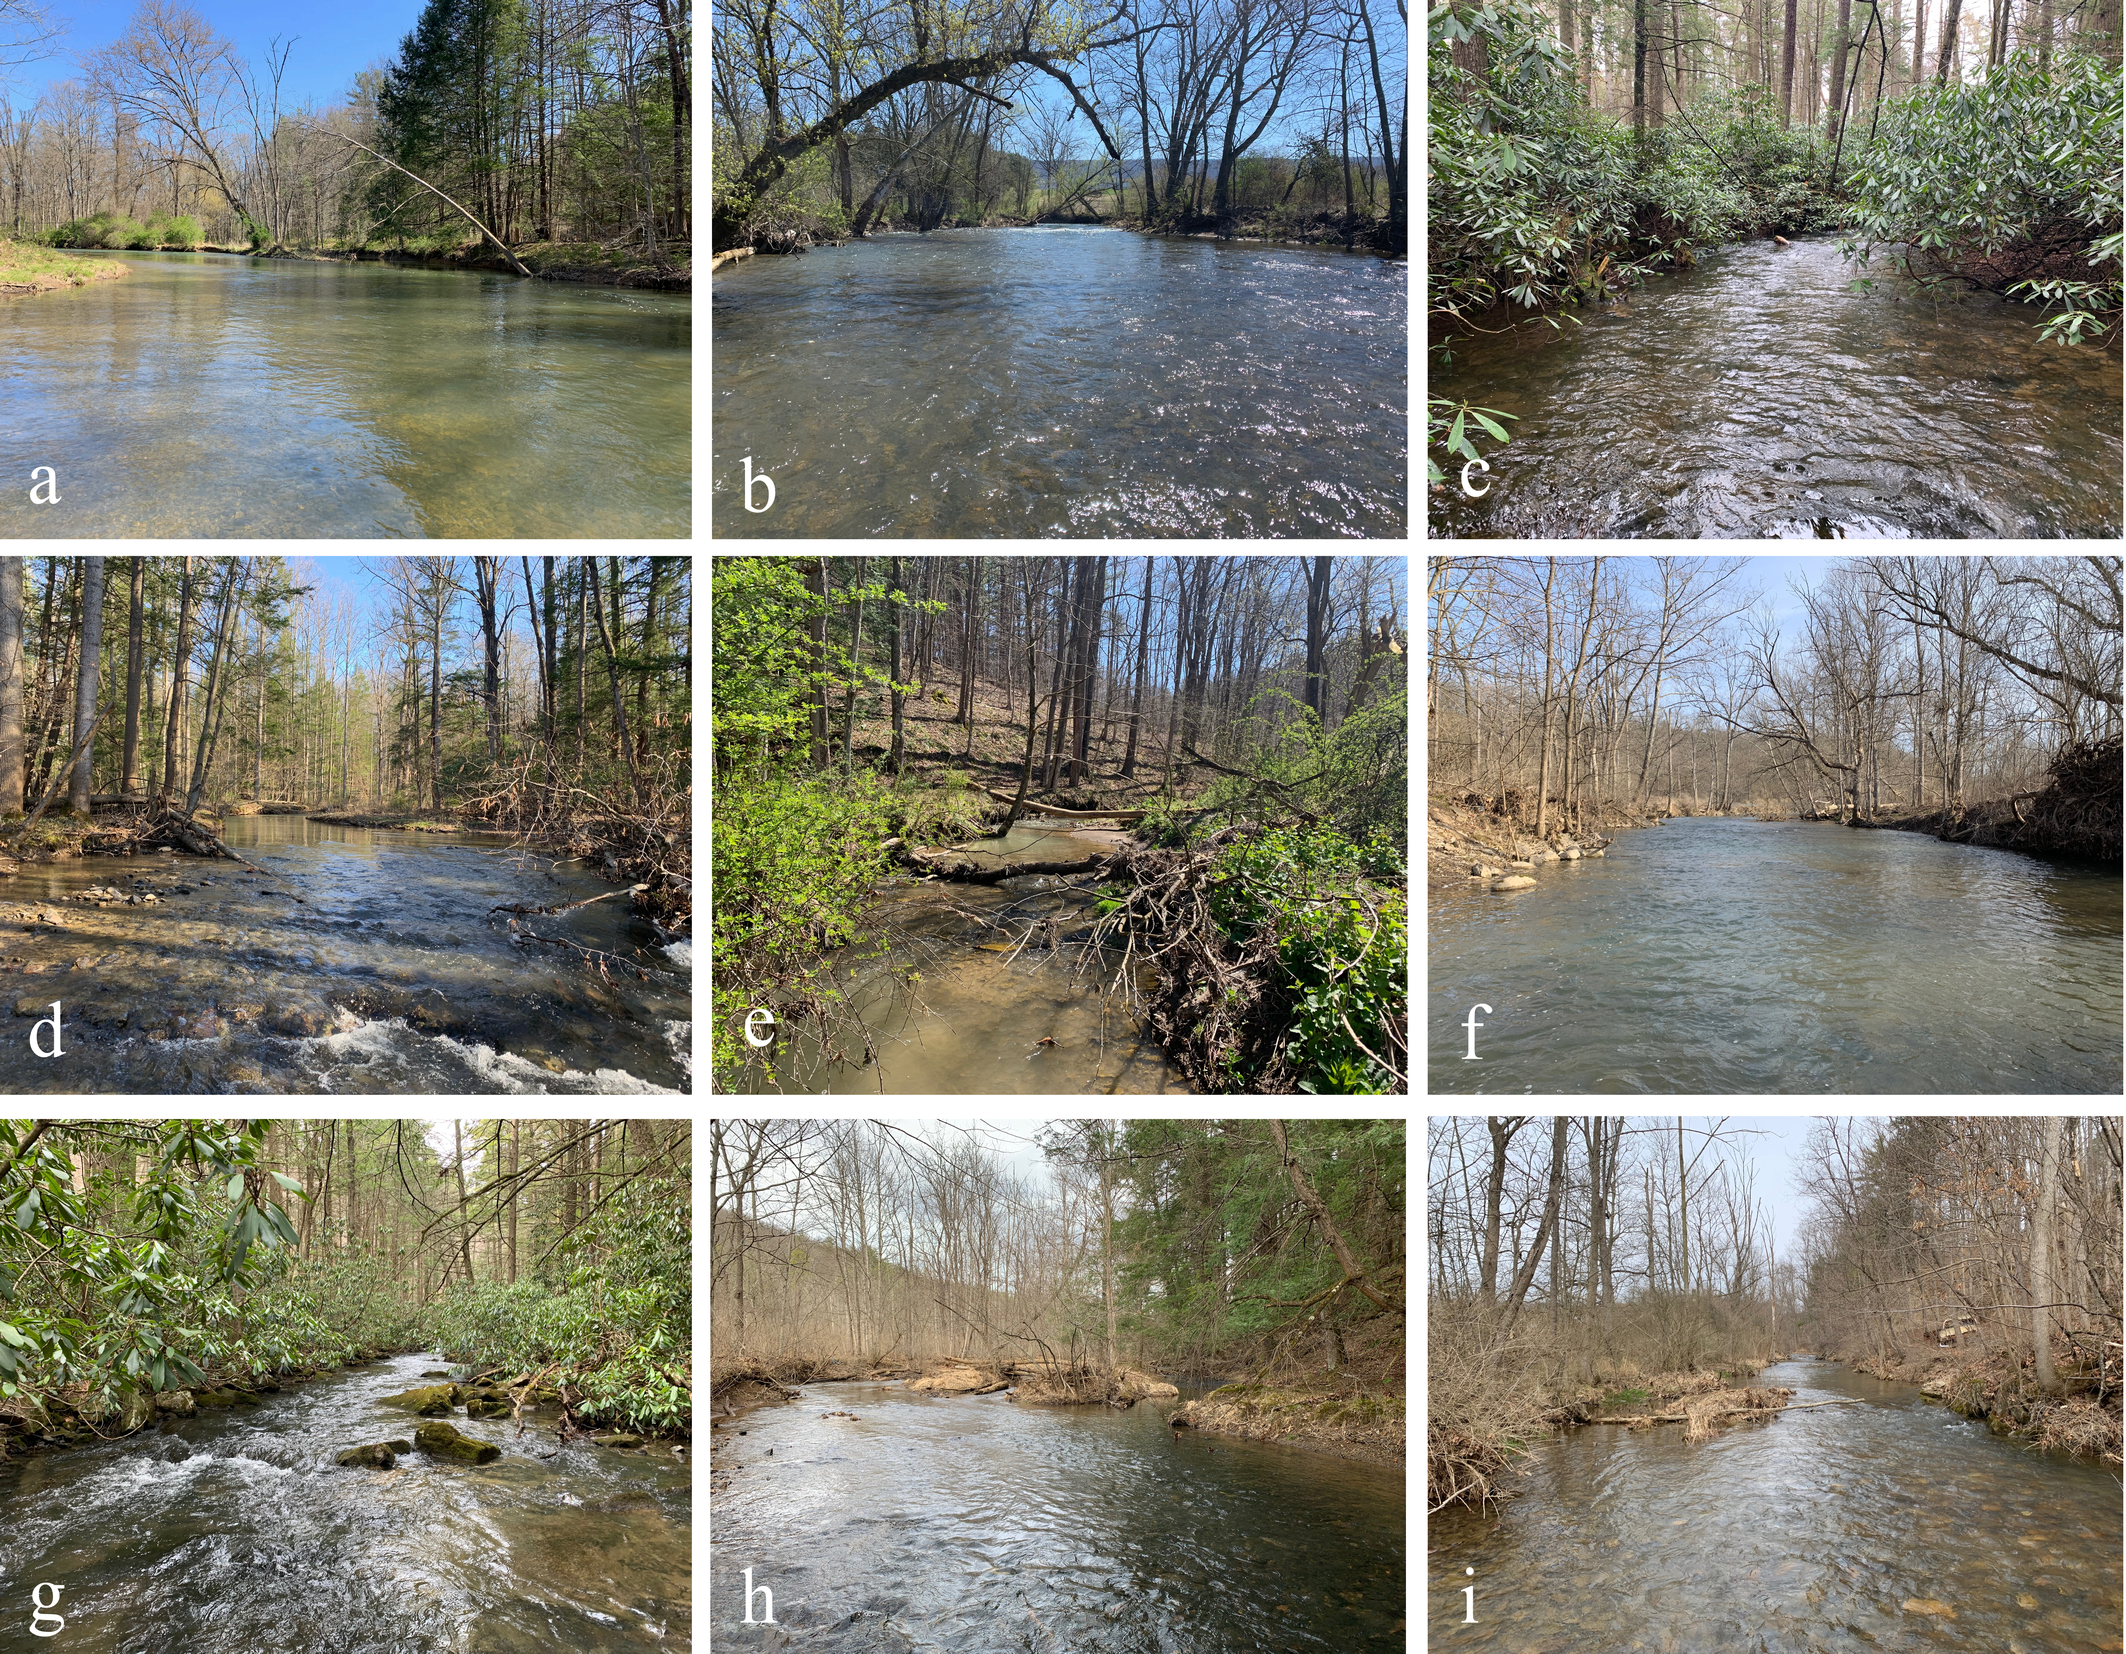
Water mite samples adhered to a standardized collection and processing methodology (Stenger and Skvarla 2022). Briefly, we identified a 100-m reach of stream at each site and completed four individual water mite collection efforts that each target a 1x1 square meter of substrate in riffle-run habitats. We composited the contents of these four collection efforts into one container to serve as the site's final water mite sample. We sorted water mites from the sample in the laboratory using a standardized six hour picking process. We placed all the picked water mites in labelled, site specific 4-dram glass vials filled with 70–80% ethanol. We identified all water mites to genus using an Olympus SZ61 stereomicroscope (0.67–4.5 magnification) and keys provided by Smit (2020) and Smith et al. (2010). All collected specimens have been accessioned in the Frost Entomological Museum at the Pennsylvania State University in State College, PA, U.S.A.
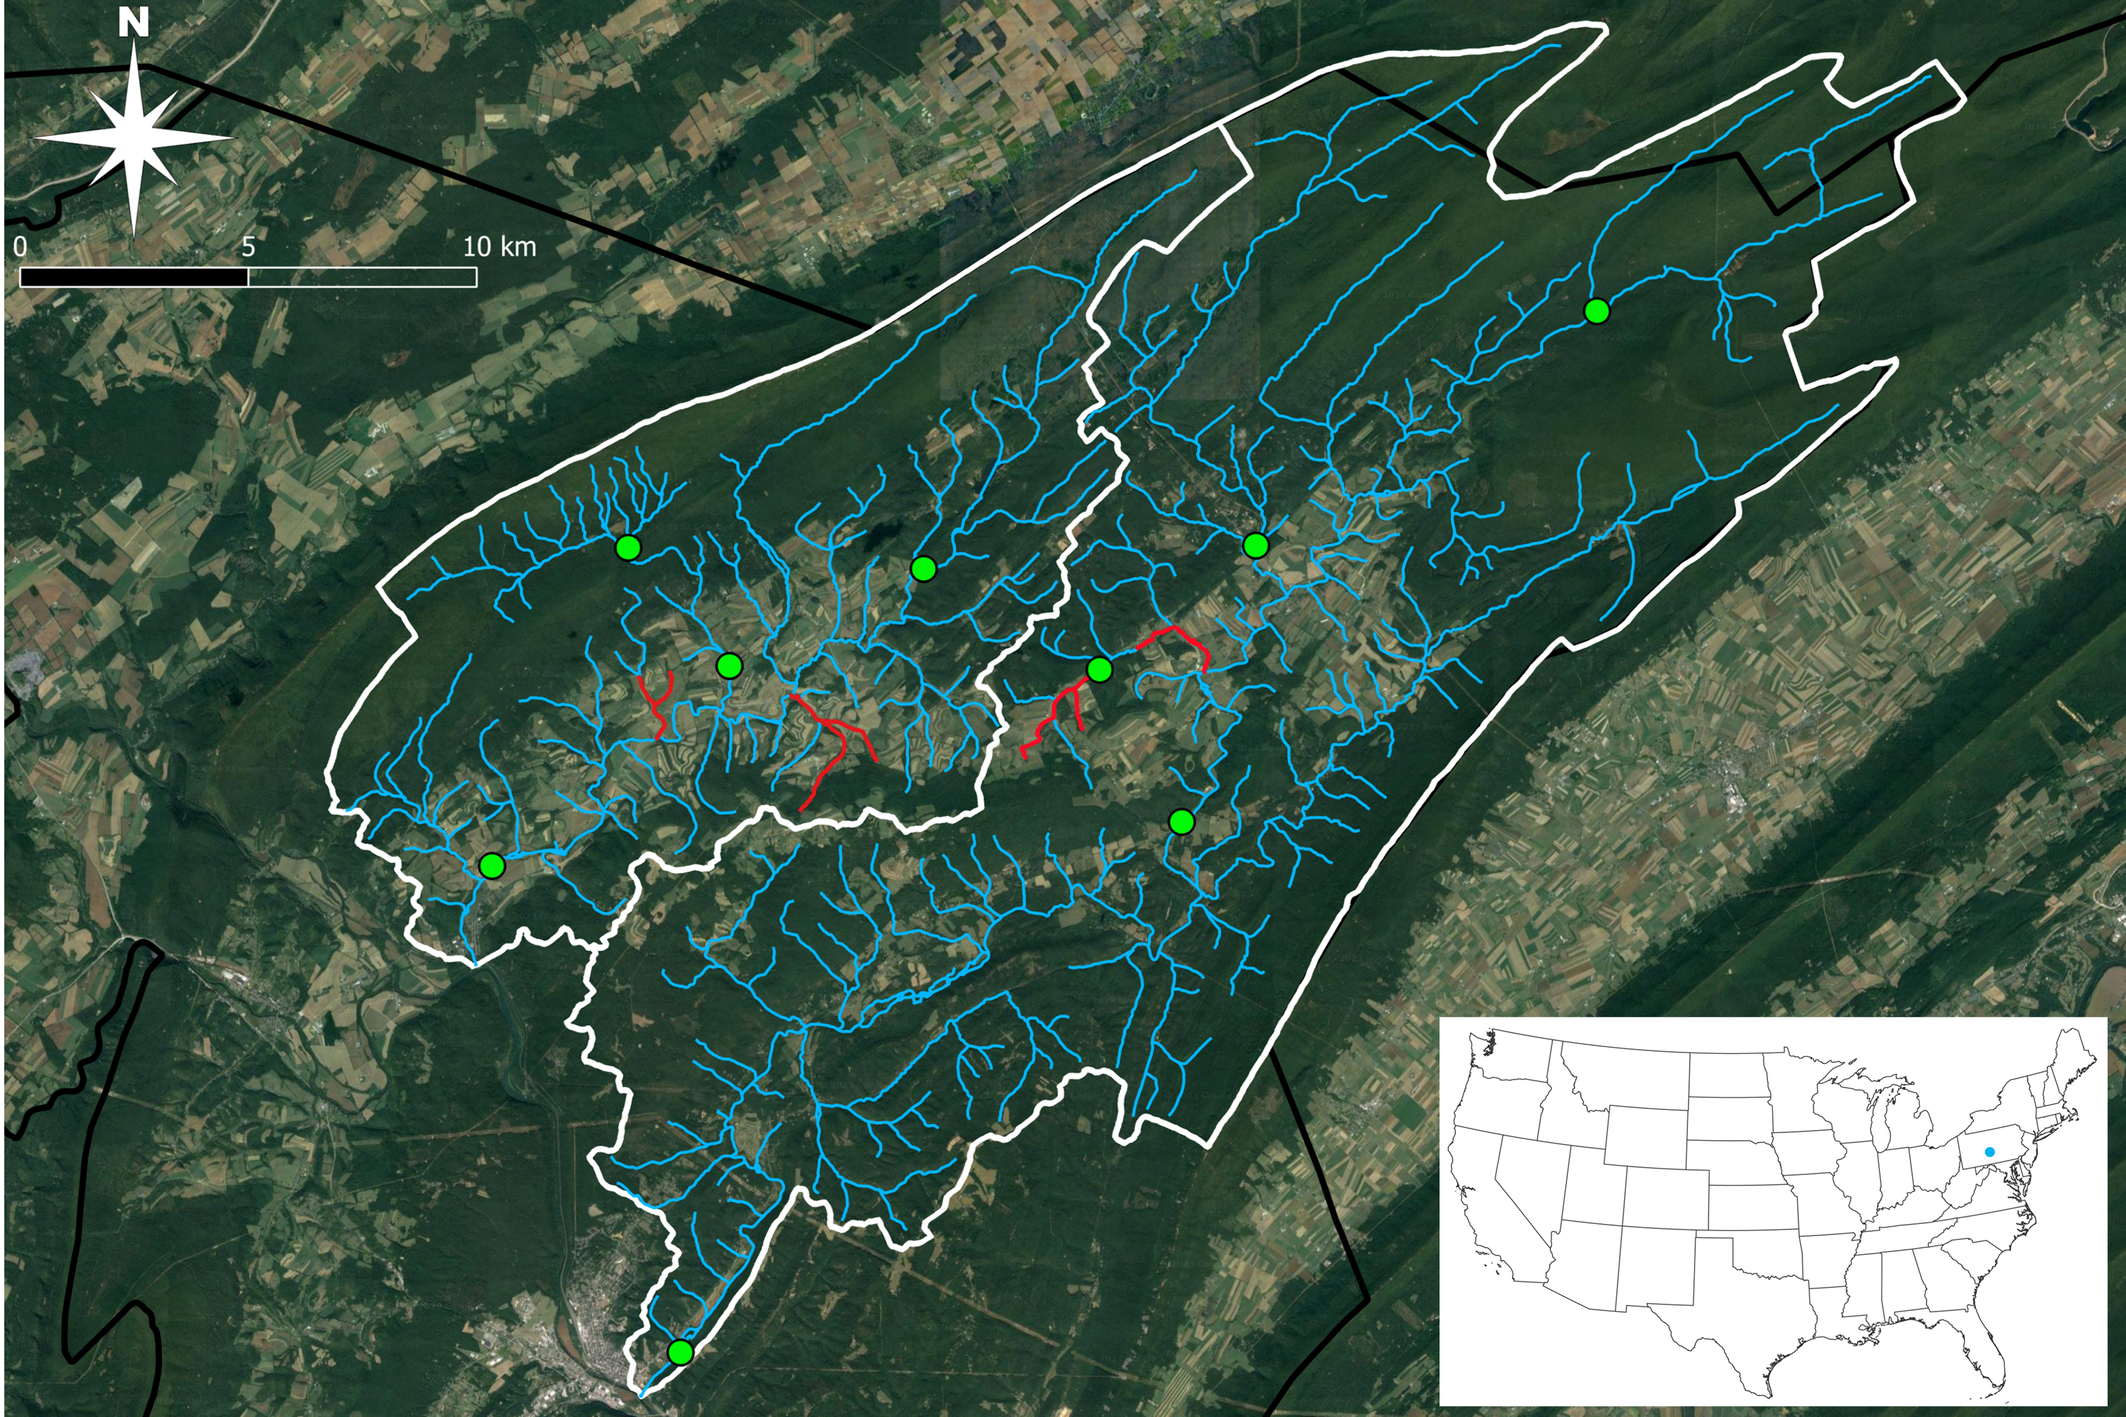
All nine study sites were located within two adjacent HUC-10 watersheds in northern Huntingdon County, Pennsylvania, USA. This includes five sites in the Standing Stone Creek watershed and four sites in the Shavers Creek watershed (Figure 2). All sites are publicly accessible. Both Shavers Creek and Standing Stone Creek are considered ecologically and economically important to local communities as they provide a source of clean drinking water to approximately 12,000 residents and support high-quality, coldwater ecosystems (HBWD 2003). While study sites are distributed throughout each watershed, water quality conditions are comparable to one another except for one site in the Standing Stone Creek watershed located along Herod Run, an impaired (unhealthy, polluted) tributary to Standing Stone Creek (PADEP 2024). The remaining eight sites are located along attaining (healthy, unpolluted) sections of Shavers Creek and Standing Stone Creek (PADEP 2024). We made all water mite collections under Pennsylvania Fish and Boat Commission Type I Scientific Collector Permit Numbers 2021-01-0017 and 2022-01-0147.
Data Analyses
Total abundance and richness metrics, as well as genus-level abundances, were calculated for each site and collection season. We also calculated means and standard deviations for assemblage-level total abundance and richness. We completed one-way ANOVA and post hoc Tukey HSD tests to compare seasonal variations in total abundance and richness, as well as generic abundances. We transformed abundance and richness counts to normal distributions by calculating the natural log for each metric prior to performing analyses. We performed all statistical tests using RStudio Version 1.4.1717 where we considered alpha values less than 0.05 significant.
Results
Download as
Order
Family
Genus
Aug-21
Oct-21
Dec-21
April-22
June-22
Aug-22
Total
Trombiidiformes
Aturidae
Aturus
101
29
16
41
154
129
470
Trombiidiformes
Axonopsidae
Ljania
12
2
0
4
1
2
21
Trombiidiformes
Axonopsidae
Woolastookia
0
0
0
3
1
1
5
Trombiidiformes
Feltriidae
Feltria
14
1
2
2
48
10
77
Trombiidiformes
Hygrobatidae
Atractides
69
38
24
38
59
42
270
Trombiidiformes
Hygrobatidae
Hygrobates
70
19
0
6
80
65
240
Trombiidiformes
Lebertiidae
Lebertia
739
197
202
148
271
465
2022
Trombiidiformes
Mideopsidae
Mideopsis
1
1
0
1
0
1
4
Trombiidiformes
Protziidae
Protzia
0
0
0
1
0
0
1
Trombiidiformes
Sperchontidae
Sperchon
1197
237
162
264
1255
506
3621
Trombiidiformes
Sperchontidae
Sperchonopsis
13
8
3
8
4
5
41
Trombiidiformes
Torrenticolidae
Monatractides
7
1
1
4
3
1
17
Trombiidiformes
Torrenticolidae
Testudacarus
1
0
1
2
5
4
13
Trombiidiformes
Torrenticolidae
Torrenticola
542
179
96
235
173
384
1609
Oribatida
1
0
0
0
1
0
2
We collected and identified 8,413 individual water mites representing 14 genera, 9 families, and 5 superfamilies between August 2021 and August 2022 (Table 1). Of the genera identified, the genus Protzia is reported here for the first time from the state. Both Testudacarus and Torrenticola had been documented during taxonomic studies (O'Neill et al. 2016, Fisher et al. 2017) while the remaining taxa were first reported in the area by the authors (Stenger et al. 2024). We were unable to identify 58 specimens (0.007% of all collected mites) and did not include these individuals in our analyses. Some of these specimens may be able to be identified further through slide mounting and examination under higher magnification or DNA barcoding.
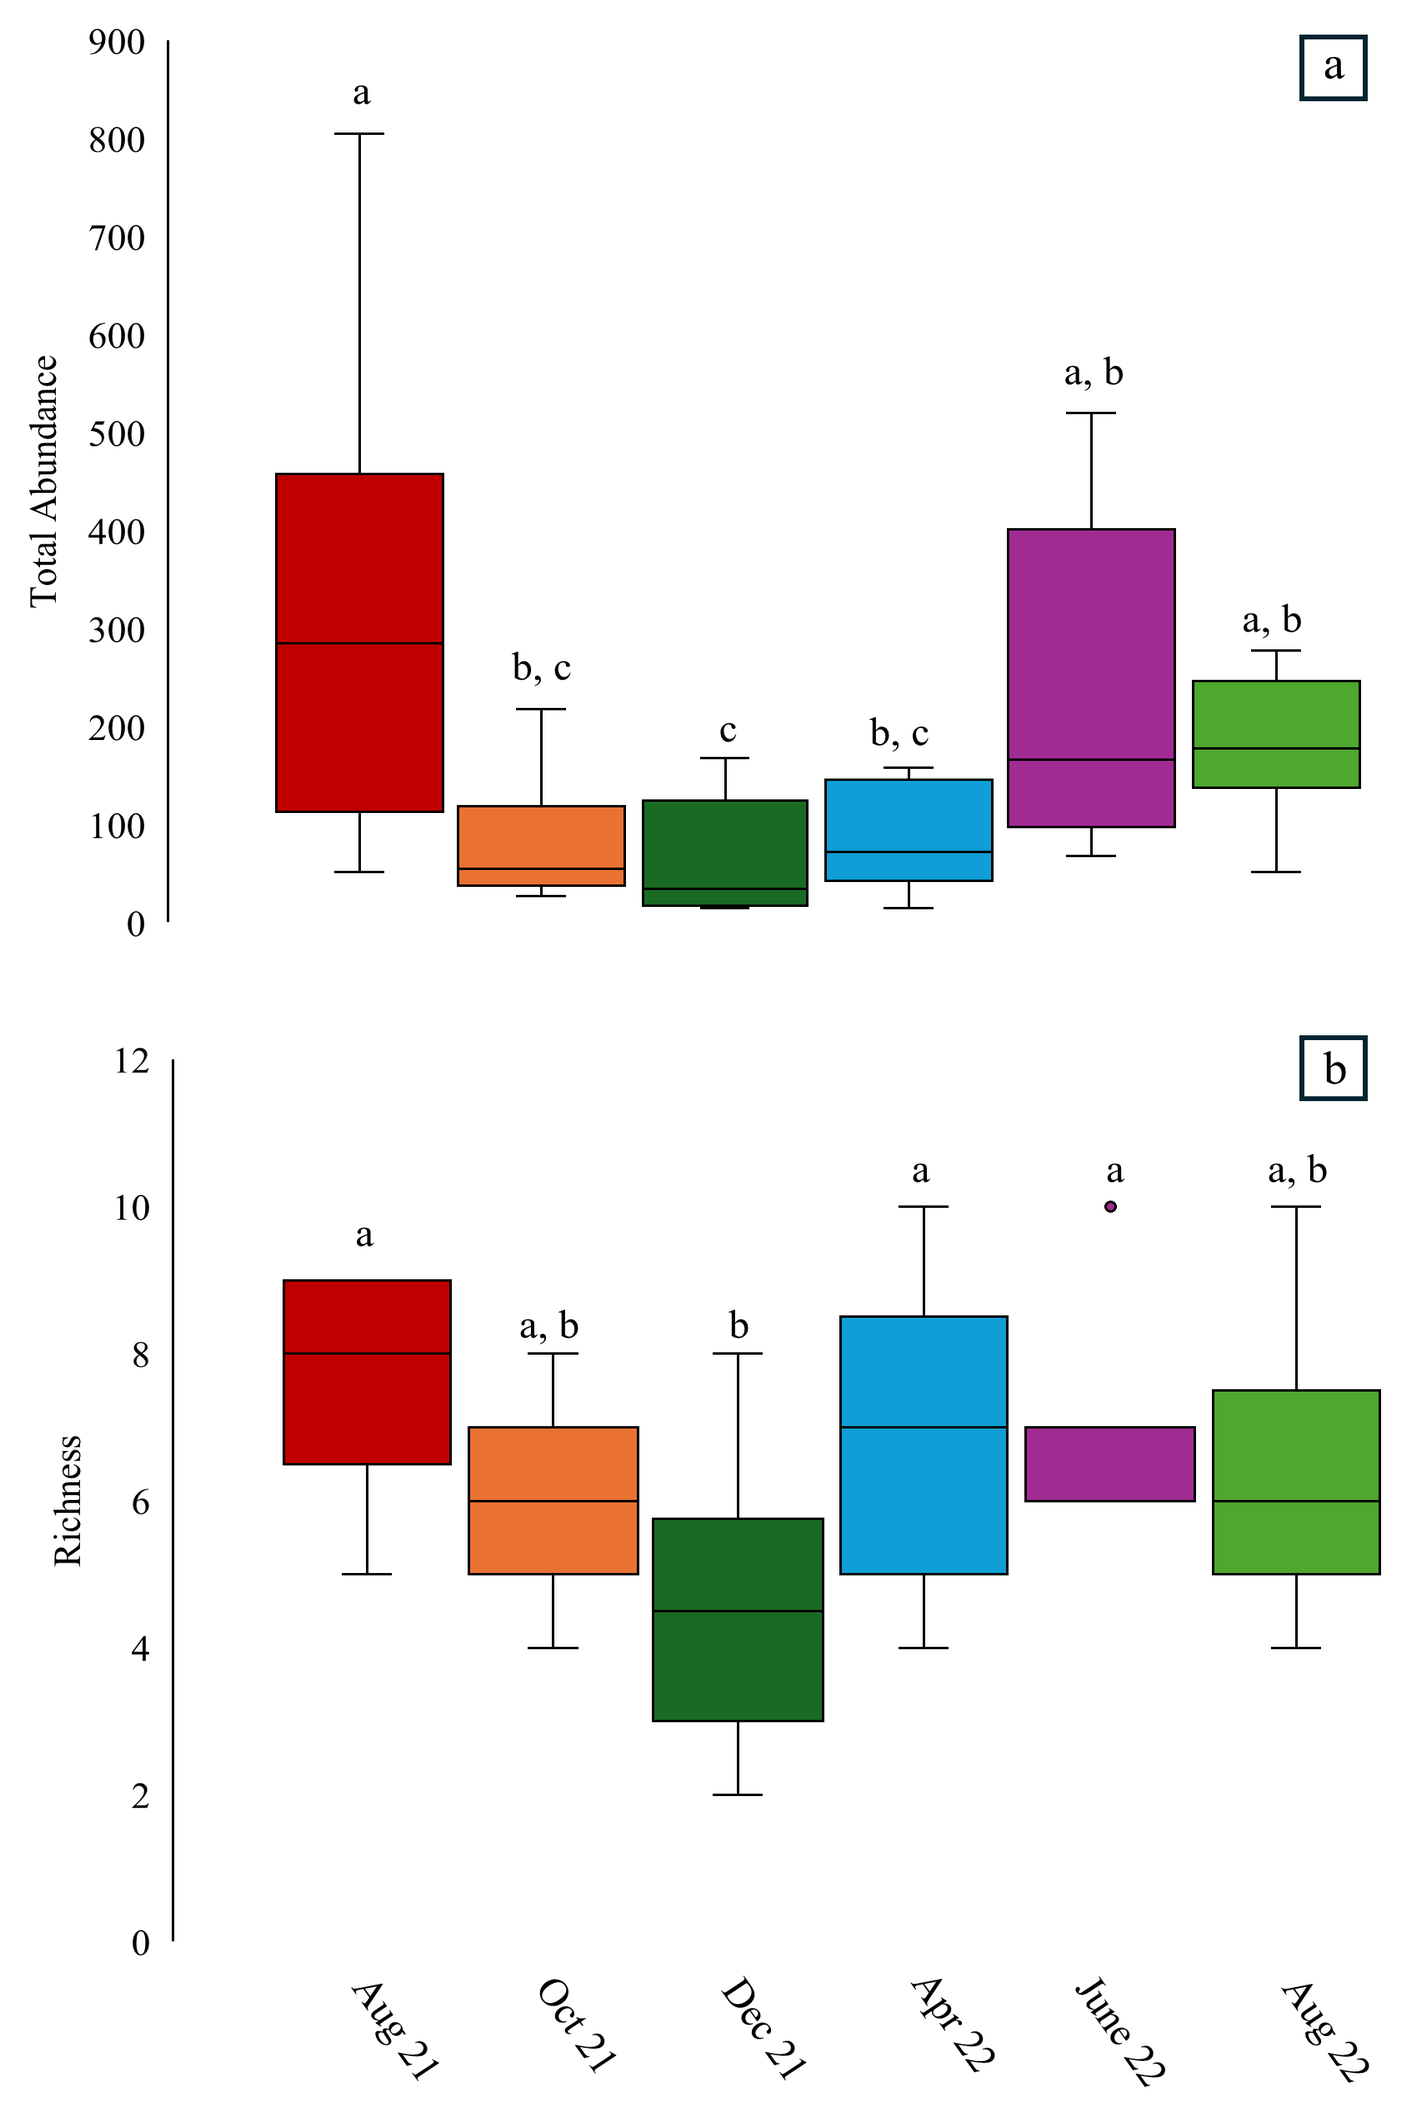
Water mites were successfully collected year-round with a clear distinction in abundance between the summer months (June–August) and the rest of the year (October–April; Figure 3a; Table 2). We found abundance was greatest in August 2021 before decreasing significantly within a few months. This decrease remained significantly lower than August 2021 throughout October 2021 (p-value = 0.01), December 2021 (p-value = 0.001), and April 2022 (p-value = 0.018). Abundance increased again in June 2022 and August 2022; however, this increase was only significantly greater than December 2021 (p-value = 0.005 and p-value = 0.024).
Download as
Collection Season (Month-Year)
Site
Lat
Lon
Aug-21
Oct-21
Dec-21
April-22
June-22
Aug-22
Shavers Creek 01
40.5856
-78.043206
363
97
N/A
153
502
160
Shavers Creek 02
40.644039
-77.931657
285
218
136
158
166
278
Globe Run 01
40.62526
-77.981622
173
55
47
54
98
164
Globe Run 01
40.646395
-78.007999
115
57
18
61
68
115
Standing Stone Creek 01
40.488299
-77.995273
324
27
17
32
520
190
Standing Stone Creek 02
40.594287
-77.864812
553
51
22
79
301
272
Standing Stone Creek 03
40.695736
-77.755652
111
41
89
72
97
178
Laurel Run
40.648881
-77.845445
805
141
168
139
191
221
Herod Run
40.624627
-77.885627
52
34
15
15
121
52
Total Abundance
2781
721
512
763
2064
1630
Mean Abundance ± SD
309 ± 228.7
80.1 ± 59.1
56.9 ± 56.4
84.8 ± 49.8
229.3 ± 164
181.1 ± 67.6
Water mite richness followed a similar pattern as abundance throughout the year (Figure 3b; Table 3); however, we found that variability was far less distinct as richness remained relatively consistent throughout the year with only a significant decrease in the winter. Specifically, richness in August 2021 (p-value = 0.001), June 2022 (p-value = 0.011), and August 2022 (p-value = 0.012) was significantly greater than richness in December 2021.
Download as
Collection Season (Month-Year)
Site
Lat
Lon
Aug-21
Oct-21
Dec-21
April-22
June-22
Aug-22
Shavers Creek 01
40.5856
-78.043206
8
7
N/A
7
6
5
Shavers Creek 02
40.644039
-77.931657
7
8
4
8
7
6
Globe Run 01
40.62526
-77.981622
9
7
5
9
6
5
Globe Run 01
40.646395
-78.007999
8
4
5
7
6
4
Standing Stone Creek 01
40.488299
-77.995273
6
5
3
5
7
6
Standing Stone Creek 02
40.594287
-77.864812
7
6
3
5
7
7
Standing Stone Creek 03
40.695736
-77.755652
9
5
8
10
10
10
Laurel Run
40.648881
-77.845445
9
6
6
8
6
8
Herod Run
40.624627
-77.885627
5
5
2
4
6
5
Mean ± SD
7.9 ± 1.3
6.0 ± 1.2
4.9 ± 1.8
7.4 ± 1.9
6.9 ± 1.2
6.4 ± 1.7
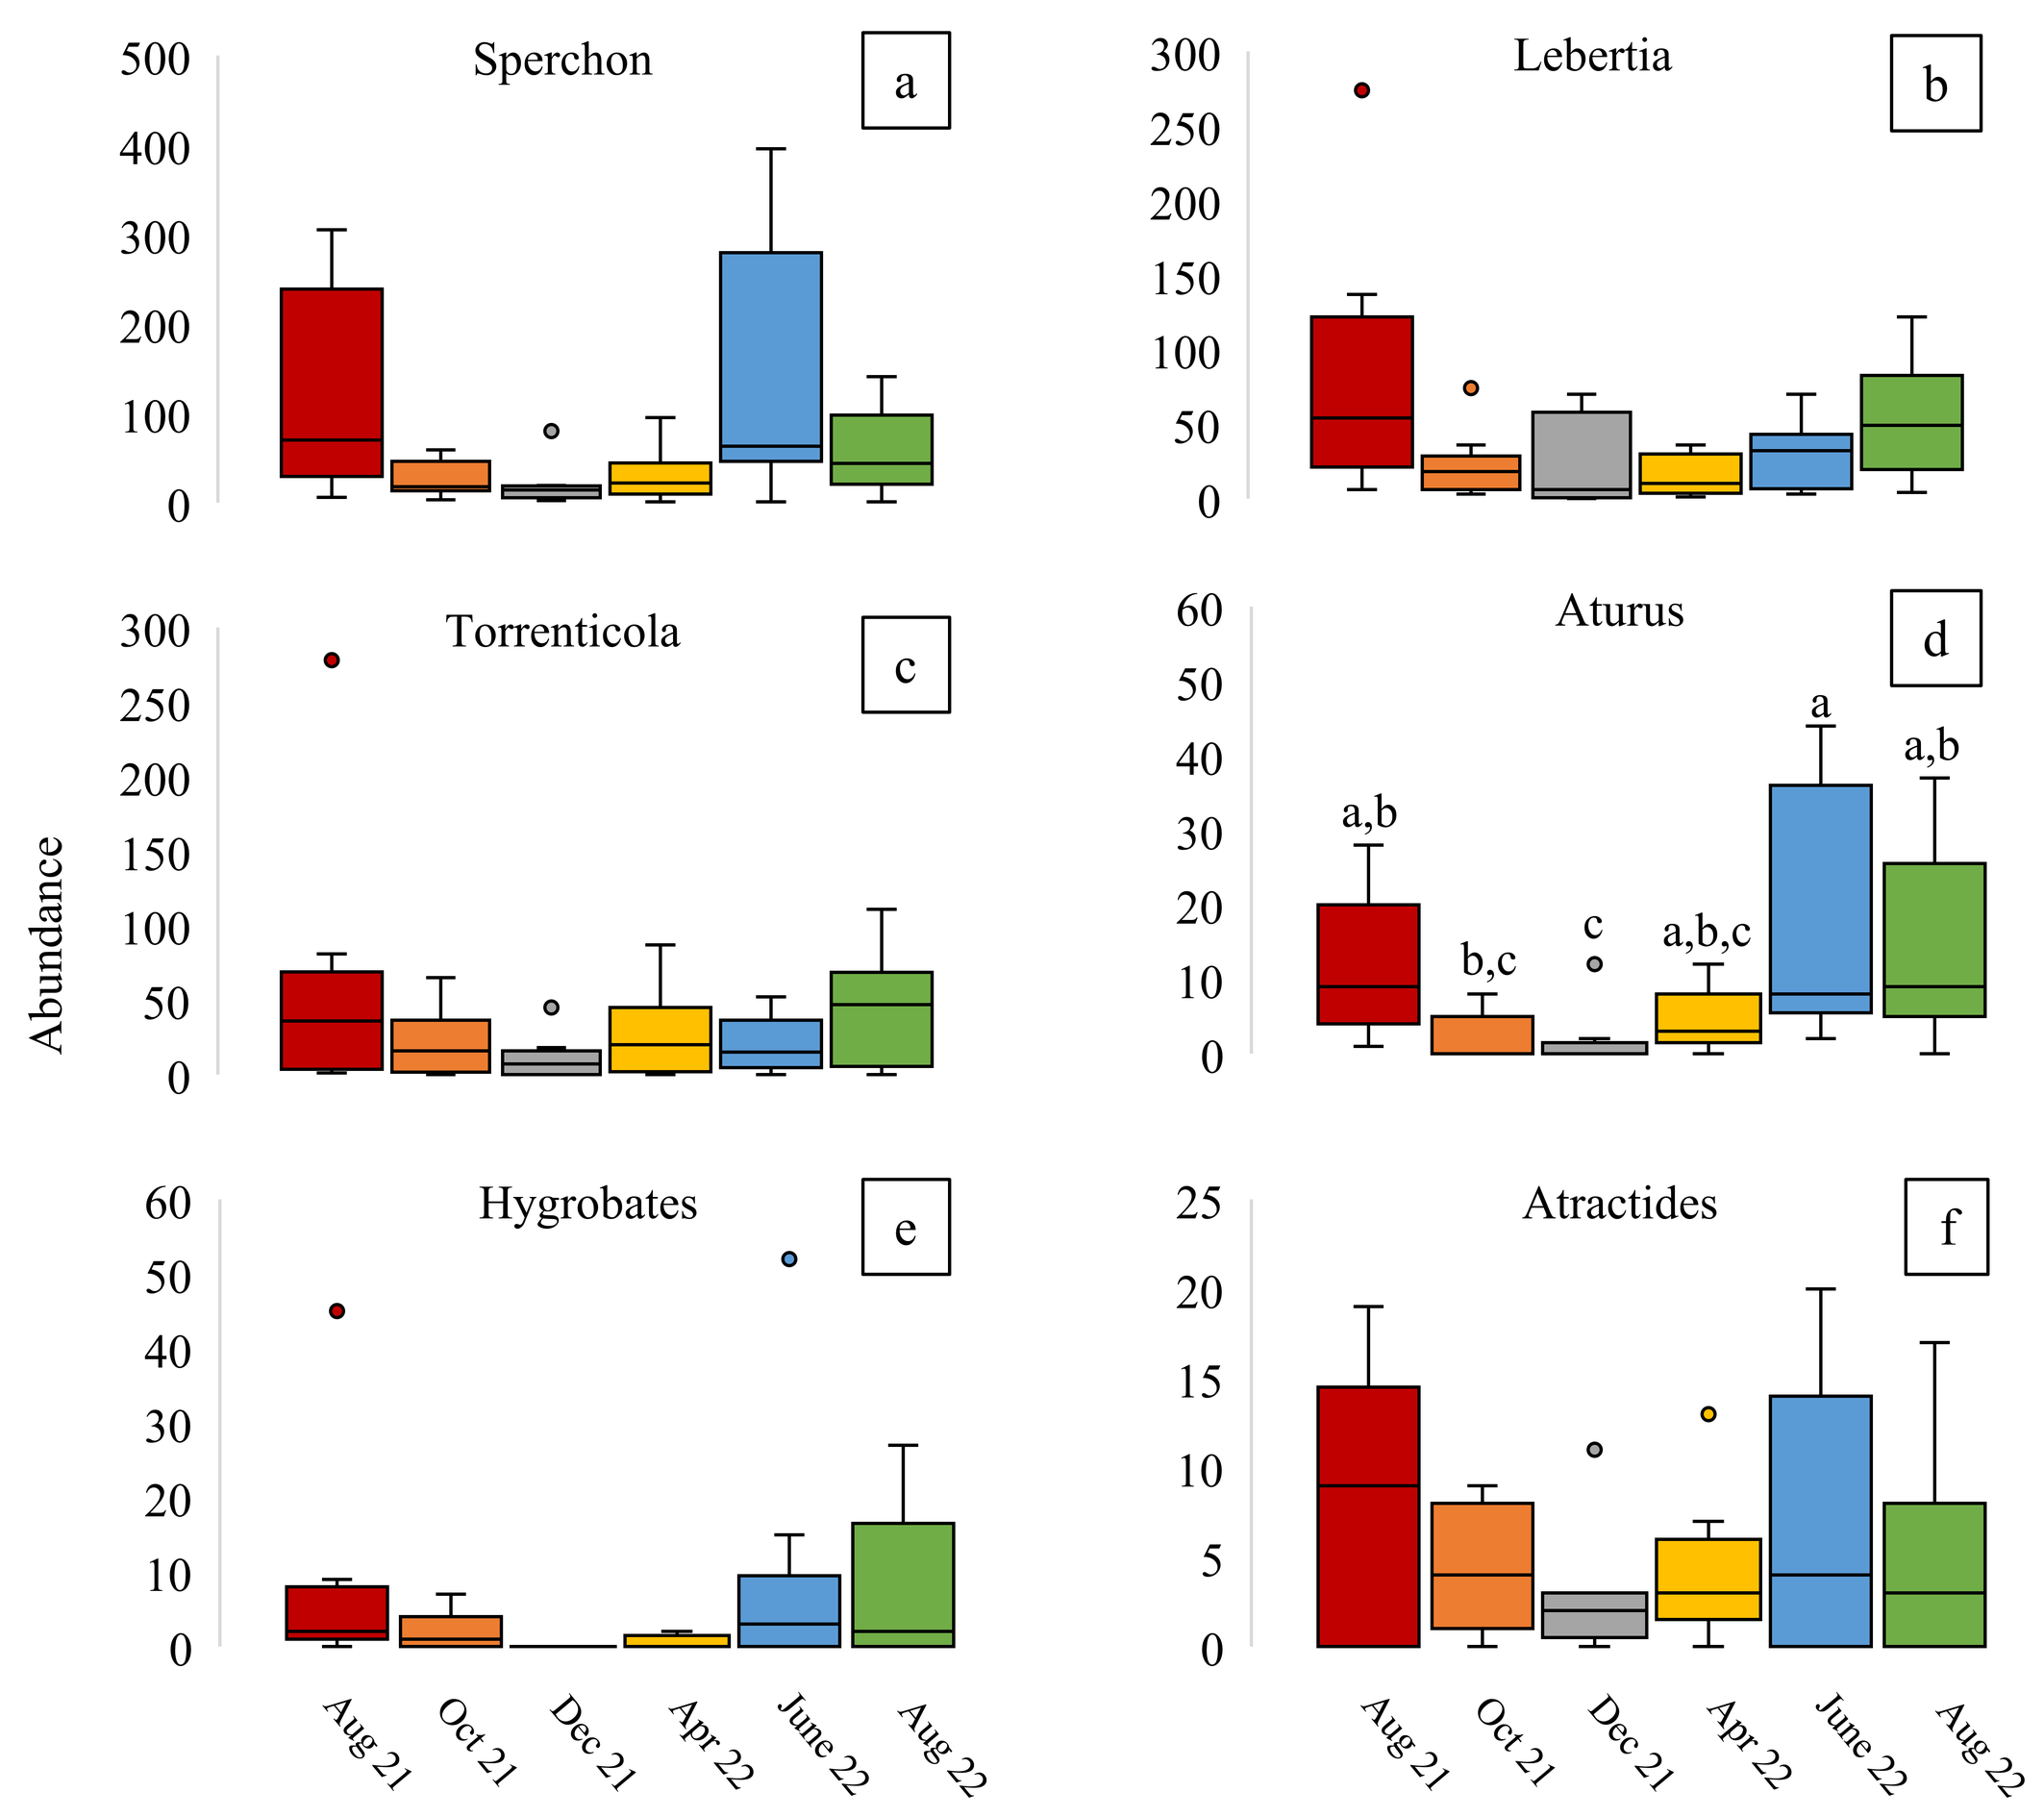
Several genera displayed comparable seasonal trends where their abundance peaked during summer months and was lowest during the winter (Figure 4). Specifically, we examined six genera that each represented more than 1% of all collected water mites: Sperchon (43%), Lebertia (24%), Torrenticola (19.1%), Aturus (5.6%), Atractides (3.2%), and Hygrobates (2.9%). However, while trends were apparent, the only significant differences were found for Aturus abundance collected between August 2021 and December 2021 (p-value = 0.014), October 2021 and June 2022 (p-value = 0.038), December 2021 and June 2022 (p-value = 0.002), and December 2021 and August 2022 (p-value = 0.007). Unfortunately, some taxa were recorded too infrequently or at such low densities (>1% of all collected water mites; Table 1) that their seasonal variation remains unclear.
Discussion
Our results confirm that lotic water mite assemblages exhibit seasonal variation, with both abundance and richness decreasing in winter. These results align with previous studies conducted in Germany (Meyer 1994; Gerecke 2002).
Previous studies also examined seasonal habitat preferences, specifically between fast-flowing, riffle habitats and slow-moving, pool habitats (Gerecke 2002). While total abundance was greatest in riffle habitats during the summer and lowest during the winter, water mites from pools were most abundant during the winter and lowest in the summer (Gerecke 2002). This finding is particularly interesting because pool-dwelling mite species were nearly absent during winter. As a result, this variation in abundance between habitat types may be attributable to lotic, riffle-dwelling mite species moving to deeper, slow-flowing areas of the stream reach during winter. Therefore, it is possible that while our samples revealed lower abundance in riffles during colder months, water mites may have been present in larger numbers in other habitats. To test this theory, we suggest that water mite abundance and diversity be surveyed in additional habitats (e.g., pools, stream edge) across seasons to track potential movement between habitats and provide a more representative view of the community.
In addition to reporting assemblage-level variation, our sampling examined the seasonal patterns of individual genera. Although significant differences in abundance between seasons were only reported for Aturus, it appears that each genus followed similar trends to those described at the assemblage level with increased abundance during the summer and lower abundance during the winter. It is possible that these seasonal trends at the generic level may become significant with more samples across additional sites. While some taxa were present year-round, the genera Sperchon and Hygrobates were nearly or completely absent during winter. Similar patterns have been reported for some European species, including Atractides nodipalpis and Hygrobates calliger, which were the two most abundant taxa reported in a German study (Gerecke 2002).
As expected, total water mite abundance was similar between samples from August 2021 and August 2022. However, four of our sites had less than half of the abundance from a year earlier (Table 2). While it is unlikely given their abundance and the size of the streams sampled, it is possible that our regular collections and removal of water mites from each study reach affected the assemblage in the second year of our sampling.
Conclusion
We documented seasonal patterns of lotic water mites in Pennsylvania, USA for the first time. While we collected water mites year-round, we found that total abundance and richness were generally greatest during the summer months (June – August) and lowest during the winter (December). While these data align with reports from Europe, future studies should examine water mites from parts of the world that experience opposite (e.g., northern vs. southern hemisphere) or no seasonal differences (e.g., the tropics of South America, Africa, East-Asia) to determine collection periods that will provide representative samples of the water mite communities in those regions. By doing so, we will further our ecological understanding of these understudied organisms, while aiding in development of water mite-inclusive biomonitoring techniques that provide natural resource managers with an additional tool to monitor and protect freshwater ecosystems.
Acknowledgement
We thank the Huntingdon County Conservation District for their technical assistance with landowner outreach and coordinating access to sample sites, Tim Charles Sr. for his assistance with field collection efforts, and J. Ray Fisher for his assistance in identifying water mites. This work was supported by the Sara Chinn Kalser Faculty Research Endowment through the Pennsylvania State University.
References
- Chalfant B. 2021. Wadable freestone riffle-run stream macroinvertebrate assessment method. Shull D. (Chapter Ed). In: Shull D. and Whiteash R. (Eds). Assessment methodology for streams and rivers. Pennsylvania Department of Environmental Protection, Harrisburg, Pennsylvania.
- Cicolani B., Miccoli F.P., Di Sabatino A., Giustini M., Lombardo P. 2009. The value of water mites (Hydrachnidia) as indicators of biodiversity and stream ecological status: an example from Abruzzo, central Italy. In: A Cruise through Nice Waters - ASLO Aquatic Sciences Meeting, 25-30. Nice, France.
- Cîmpean M.D. 2010. Taxonomical and ecological study of water mite communities (Acari, Hydrachnidia) from the River Somesul Mic catchment area and their role as indicators of water quality. English summary of PhD Dissertation, Babes-Bolyai University, Cluj Napoca, Romania.
- Di Sabatino A., Smit H., Gerecke R., Goldschmidt T., Matsumoto N., Cicolani B. 2008. Global diversity of water mites (Acari, Hydrachnidia, Arachnida) in freshwater. Hydrobiologia, 595: 303-315. https://doi.org/10.1007/s10750-007-9025-1
- Fisher J.R., Fisher D.M., Skvarla M.J., Nelson W.A., Dowling A.P.G. 2017. Revision of torrent mites (Parasitengona, Torrenticolidae, Torrenticola) of the United State and Canada: 90 descriptions, molecular phylogenetics, and a key to species. Zookeys, 701: 1-496. https://doi.org/10.3897/zookeys.701.13261
- Gerecke R. 2002. The water mites (Acari, Hydrachnidia) of a little disturbed forest stream in southwest Germany - a study on seasonality and habitat preference, with remarks on diversity patterns in different geographical areas. In: Bernini F., Nannelli R., Nuzzaci G., de Lillo E. (Eds), Acarid Phylogeny and Evolution: Adaptation in Mites and Ticks, 69-89. Netherlands, Springer. https://doi.org/10.1007/978-94-017-0611-7_9
- Gerecke R., Schwoerbel J. 1991. Water quality and water mites (Acari, Actinedida) in the upper Danube region, 1959-1984. In: Dusbábek F., Bukva V. (Eds), Modern Acarology: Proceedings of the 8th International Congress of Acarology, 1: 483-491. The Hague, Prague and SPB Academic Publishing.
- Goldberg E.D., Hodge V., Griffin J., Gamble E., Bricker O.P., Matisoff G., Holdren G.R. 1978. A pollution history of Chesapeake Bay. Geochimica et Cosmochimica Acta, 42(9): 1413-1425. https://doi.org/10.1016/0016-7037(78)90047-9
- Goldschmidt T. 2009. The water mite genus Torrenticola (Hydrachnidia: Torrenticolidae) in Costa Rica-ecology, diversity, and bioindicator potential. In: Sabelis M.W., Bruin J. (Eds), Trends in Acarology, 185-191. https://doi.org/10.1007/978-90-481-9837-5_30
- Goldschmidt T. 2016. Water mites (Acari, Hydrachnidia): a powerful but widely neglected bioindicator - a review. Neotropical Biodiversity, 2: 12-25. https://doi.org/10.1080/23766808.2016.1144359
- Goldschmidt T, Helson J.E., Williams D.D. 2016. Ecology of water mites in Panama - first data on water mites (Acari, Hydrachnidia) as bioindicators in the assessment of biological integrity of neotropical streams. Limnologica, 59: 63-77. https://doi.org/10.1016/j.limno.2016.03.007
- Growns J.E. 2001. Aquatic mites as bioindicators, with an Australian example. In: Halliday R.B., Walter D.E., Proctor H.C., Norton R.A., Colloff M.J. (Eds), Acarology: Proceedings of the 10th International Congress, 136-142. Melbourne, CSIRO Publishing.
- Gurung M.M., Dorji C., Gurung D.B., Smit H. 2022. Environmental factors affecting water mites (Acari: Hydrachnidia) assemblage in streams, Mangde Chhu basin, central Bhutan. Journal of Threatened Taxa, 14(10): 21976-21991. https://doi.org/10.11609/jott.7979.14.10.21976-21991
- HBWD 2003. Huntingdon Borough Water Department. 2003. Source Water Assessment Public Summary, Huntingdon Borough Water Department PWSID 4310012, Standing Stone Creek, 001. Huntingdon, Pennsylvania. https://greenport.pa.gov/elibrary/PDFProvider.ashx?action=PDFStream&docID=3332&chksum=&revision=0&docName=HUNTINGDON+BOROUGH+WATER +DEPARTMENT&nativeExt=pdf&PromptToSave=False&Size=106918&ViewerMode=2&overlay=0
- Meyer E.I. 1994. Species composition and seasonal dynamics of water mites (Hydracarina) in a mountain stream (Steina, Black Forest, southern Germany). Hydrobiologica, 288: 107-117. https://doi.org/10.1007/BF00007130
- Miccoli F.P., Lombardo P., Cicolani B. 2013. Indicator value of lotic water mites (Acari: Hydrachnidia) and their use in macroinvertebrate-based indices for water quality assessment purposes. Knowledge and Management of Aquatic Ecosystems, 411: 08. https://doi.org/10.1051/kmae/2013075
- O'Neill J.C., Fisher J.R., Nelson W.A., Skvarla M.J., Fisher D.M., Dowling A.P.G. 2016. Systematics of testudacarine torrent mites (Acari, Hydrachnidia, Torrenticolidae) with descriptions of 13 new species from North America. Zookeys, 582: 13-110.
- PADEP 2024. Pennsylvania Department of Environmental Protection (PADEP). 2024. 2024 Pennsylvania integrated water quality monitoring and assessment report. Pennsylvania Department of Environmental Protection, Harrisburg, Pennsylvania. https://storymaps.arcgis.com/stories/7af67824d6924b88b544dbad302ebc4f
- Shull D., Whiteash R., (Eds). 2021. Assessment methodology for streams and rivers. Pennsylvania Department of Environmental Protection, Harrisburg, Pennsylvania.
- Smit H. 2020. Water mites of the world with keys to the families, subfamilies, genera, and subgenera (Acari: Hydrachnidia). Monografieën van de Nederlandse Entomologische Vereniging, no. 12. 774 pp.
- Smith I.M., Cook D.R., Smith B.P. 2010. Water mites (Hydrachnidiae) and other arachnids. In: Thorp J., Covich A. (Eds). Ecology and Classification of North American Freshwater Invertebrates, 485-586. Massachusetts, Cambridge: Academic Press. https://doi.org/10.1016/B978-0-12-374855-3.00015-7
- Stenger L.R., Ferguson F.M., Skvarla M.J. 2024. Water mites and their use as bioindicators of water quality conditions: a Pennsylvania case study. Acarologia, 64(1): 146-163. https://doi.org/10.24349/qo5i-rvld
- Stenger L.R., Skvarla M.J. 2022. A quantitative method for collecting water mites in lotic, riffle-run habitats for water quality biomonitoring. Acarologia, 62(3): 621-636. https://doi.org/10.24349/05qz-joak
- Vasquez A.A., Kabalan B.C., Miller C.J. 2022. First data on water mite (Acari, Hydrachnidia) assemblages of Point Rosa Marsh, Harrison Township, Michigan, USA, and their use as environmental bioindicators of aquatic health. Acarologia, 62(3): 653-665. https://doi.org/10.24349/2m5p-c5ku
- Zawal A., Stryjecki R., Stępień E., Buczyńska E., Buczyński P., Czachorowski S., Pakulnicka J., Śmietana P. 2017. The influence of environmental factors on water mite assemblages (Acari, Hydrachnidia) in a small lowland river: an analysis at different levels of organization of the environment. Limnology, 18(3): 333-343. https://doi.org/10.1007/s10201-016-0510-y


2025-06-04
Date accepted:
2025-08-22
Date published:
2025-09-04
Edited by:
Mąkol, Joanna

This work is licensed under a Creative Commons Attribution 4.0 International License
2025 Stenger, Logan R.; Ferguson, Francesca M. and Skvarla, Michael J.
 Download article
Download the citation
RIS with abstract
(Zotero, Endnote, Reference Manager, ProCite, RefWorks, Mendeley)
RIS without abstract
BIB
(Zotero, BibTeX)
TXT
(PubMed, Txt)