


Damage caused by Tetranychus urticae Koch (Tetranychidae) in grapevine leaves Vitis vinifera (Vitaceae)
Pavan, Aline Marjana  1
; Da-Costa, Tairis
2
; Picoli Ribeiro, Luiza
3
and Juarez Ferla, Noeli
4
1
; Da-Costa, Tairis
2
; Picoli Ribeiro, Luiza
3
and Juarez Ferla, Noeli
4
1✉ Laboratório de Acarologia, Tecnovates, Universidade do Vale do Taquari – Univates, Lajeado, RS, Brasil.
2Laboratório de Acarologia, Tecnovates, Universidade do Vale do Taquari – Univates, Lajeado, RS, Brasil & Laboratório de Evolução, Ecologia Química e Quimiotaxonomia, Instituto de Biociências, Universidade Federal do Rio Grande do Sul, Porto Alegre, RS, Brasil.
3Laboratório de Acarologia, Tecnovates, Universidade do Vale do Taquari – Univates, Lajeado, RS, Brasil.
4Laboratório de Acarologia, Tecnovates, Universidade do Vale do Taquari – Univates, Lajeado, RS, Brasil & Programa de Pós-Graduação em Ambiente e Desenvolvimento – PPGAD, Universidade do Vale do Taquari – Univates, Lajeado, RS, Brasil & CNPq Researcher.
2025 - Volume: 65 Issue: 3 pages: 827-840
https://doi.org/10.24349/hif2-77tlOriginal research
Keywords
Abstract
Introduction
Standing out as one of the most important activities in Brazil, agro-industries are present in every state of the country and have a significant impact, driving both the economy and the social sphere. In this context, the viticulture sector stands out as one of the most relevant, playing a crucial role in the development of regions through the production of grapes and their derivative products (Mello 2013; Silva et al. 2018), encompassing fine, American, and hybrid grapes, whether for fresh consumption or for the production of wines, juices, and other derivative products (Würz 2018).
The Chardonnay cultivar (Vitis vinifera L.), native to France's Burgundy region, originated from a natural cross between Pinot noir and Gouais Blanc grapes (Bowers et al. 1999). Recognized globally as a benchmark for white wines, it is highly adaptable and widely cultivated, earning the title ''queen of white grapes'' (Sweet 2007; Tarouco et al. 2024). In southern Brazil, it has stood out since the 1980s in the production of fine white and sparkling wines (Rizzon et al. 2009). Its cultivation demands careful management from budding to harvest (Romagna 2018). Grape development is influenced by biotic and abiotic factors such as insect, mite, fungal, and viral infestations (Prazaru et al. 2023). Viticulture is also highly vulnerable to pests and diseases, which can reduce both yield and quality (Botton et al. 2003; Soria and Dal Conte 2005).
Recently, mite populations have increased significantly in vineyards due to favorable conditions and poor management practices, including indiscriminate pesticide use (Botton et al. 2015; Kemerich et al. 2022). Several species from the families Eriophyidae, Tarsonemidae, Tenuipalpidae, and Tetranychidae have reached pest status in grapevines (Monteiro 2002; Moraes and Flechtmann 2008; Ferla and Botton 2008; Johann et al. 2014). The extent of plant damage depends on factors such as grape variety, plant vigor, mite density, feeding duration, harvest timing, and climate (Marini et al. 1994).
Phytophagous mites, with emphasis on Tetranychus urticae Koch (Acari: Tetranychidae), feed by exuding plant cell fluids through their stylets inserted into the leaf tissue (Moraes and Flechtmann 2008; Walter and Proctor 1999), removing the cytoplasmic content (De Araújo and Daud 2018). T. urticae feeds on leaves of all ages, with a preference for older ones, causing red spots that can lead to necrosis and/or complete drying of the leaves (Oliveira and Paranhos 2021). The feeding process of T. urticae induces chlorosis, cell death, and visible changes in leaf coloration, reflecting substantial plant damage (Flechtmann 1983; Nagaraj et al. 2002). This damage disrupts critical physiological processes, such as photosynthesis (Bueno et al. 2009) and respiration (Peterson and Higley 1993), which can lead to changes in growth intensity, flowering, and yield (Tomczyk and Kropczynska 1985). In Brazil, it is estimated that there are over 40,000 species of mites, of which approximately 30% are phytophagous (De Araújo and Daud 2018).
Chlorophylls are essential pigments for photosynthesis, absorbing light mainly in the blue and red wavelengths and converting it into chemical energy, a process led by chlorophyll a (Chl a) with the help of Chl b, carotenoids and phycobilins, which expand the absorption spectrum (Costa et al. 2019). Classified as unstable pigments due to several environmental and physiological factors, Chl a and Chl b play crucial roles in the photosynthetic apparatus of most plants (Streit et al. 2005). Chl a, present in all oxygenic photosynthetic organisms, is vital for the conversion of light into chemical energy (Streit et al. 2005). Although not directly involved in photochemistry, Chl b stabilizes chlorophyll-binding proteins and enhances light capture, occurring only in higher plants, green algae and some bacteria (Tanaka and Tanaka, 2011; Streit et al. 2005).
In agricultural contexts like vineyards, the quality and yield of the crop are closely linked to canopy biomass and leaf vigor, making chlorophyll content a reliable indicator of plant health. Modern proximal sensing techniques offer precise and efficient alternatives to traditional chlorophyll measurement, aiding in real-time assessment of plant vitality (Arruda et al. 2024).
However, infestations by phytophagous mites, particularly T. urticae, can severely disrupt these physiological processes by depleting chlorophyll levels. Known as a major pest in crops like rose (Rosa sp.), T. urticae reduces chlorophyll content as it feeds, especially at high densities, leading to overexploitation and, in severe cases, plant death (Chacón-Hernández et al. 2018).
Given that increased mite density is associated with reductions in photosynthetic rate, transpiration, and chlorophyll content, demonstrating the negative impact on plant performance (Landeros et al. 2004). Understanding the relationship between pest population density and the extent of damage to grapevines is essential for establishing control thresholds. Considering this finding and the importance of this crop, the present study aimed to: i) evaluate changes in the concentration of Chl a, Chl b, and total chlorophyll (Chl t), ii) assess membrane integrity, and iii) measure stomatal density, caused by T. urticae in different populations, on Chardonnay grapevine leaves.
Material and methods
Stock culture of T. urticae
The population was established from specimens collected from Chardonnay grapevines in Garibaldi, Rio Grande do Sul. These specimens were maintained on bean plants (Phaseolus vulgaris L.: Fabaceae) using commercial Carolina Soil® substrate in a controlled environment room at 26 ± 1 °C, with a 12-hour photoperiod and relative humidity (RH) of 50 ± 5%.
Grapevine plants
For this experiment, Chardonnay grapevine seedlings were used, purchased from the Rasip Agropastoril S/A nursery in Vacaria, Rio Grande do Sul. The plants were potted individually in 11-liter containers filled with a sterilized mixture of vermiculite, forest soil, and Carolina Soil® substrate (1:2:3). Watering was performed weekly, with the amount of water determined by the onset of drainage into the saucer placed under the pot, thus ensuring an adequate supply for the plants' water needs. The cultivation environment was maintained under controlled conditions at 25 ± 1 °C, with a 12-hour light period and 70 ± 10% RH.
Infestation of plants
Plants that were 30 days old were exposed to different populations of female T. urticae, with no specific date provided. Six leaves were randomly selected from across the plant to ensure similar leaf area for each. The petioles of the selected leaves were coated with entomological glue and cotton, serving as a barrier to prevent the mites from migrating to other parts of the plant. For each treatment, three plants were used, with the release of 0 (Control), 25 (T25), 50 (T50), and 100 (T100) mites/leaf/treatment over an eight-day period. The plants were maintained under controlled conditions at 25 ± 1 °C, with a 12-hour light period and 60 ± 10% RH.
Leaf area
The direct destructive method was used, which involves removing leaves from the plant (Ramos et al. 2015). After detachment, the leaves were identified and placed on a sheet of white paper measuring 21×29.7 cm (A4), with a 20 cm ruler used to calibrate the software. They were then individually photographed using a 12-megapixel digital camera, without flash to avoid reflections. The camera was positioned perpendicular to the leaf at an approximate height of 30 cm, with this distance measured using a millimeter ruler (adapted from Ramos et al. 2015; Pohlmann et al. 2021). The images obtained under sunlight were transferred to a computer and analyzed using ImageJ® software (Image Processing and Analysis in Java), which calculates the area of each element in the image, known as pixels, determining the area of each leaf separately. For each treatment, three plants were assessed, with three leaves taken from each plant, totaling nine leaves per treatment.
Stomatal density
To investigate whether stomatal density in V. vinifera leaves is affected by the presence and abundance of T. urticae, microscope slides were prepared using the leaf clearing method. The leaves were detached, and two cuts (0.7 × 0.7 cm) were made in the median region, consistently in the same area on all leaves to ensure standardization. The fragments were then immersed in a 10% sodium hydroxide (NaOH) solution for three hours. The leaf fragments were then clarified in diluted commercial sodium hypochlorite (1:1) for approximately 30 minutes each, with two washing repetitions. After this step, the sections were placed in water, followed by immersion in 70% ethanol and then 99% ethanol, each for 10 minutes. Finally, the fragments were stained with 0.01% Safranin for three minutes and then mounted on microscope slides to visualize and count the stomata. For each treatment, three plants were evaluated, with two leaves per plant, totaling six leaves per treatment. For each replicate, four slides were prepared: two with the abaxial surface up and two with the adaxial surface up. A stereomicroscope (ZEISS Axio Imager 2) with a 40x objective lens was used for visualization and counting, analyzing an area of 0.312 mm² per leaf. To convert the data to a per-area basis, the stomata were counted and divided by the 0.312 mm² area observed through the microscope. This conversion was done using the following formula: D= number of stomata/0.312 mm2, where D is the stomatal density (De Bem et al. 2020).
Chlorophyll content
To assess the chlorophyll content (Chl a, Chl b and total) content in the leaves before their removal for subsequent tests, we used the ClorofiLOG® electronic chlorophyll meter (model CFL 1030) from Falker. This device estimates chlorophyll content based on light transmittance at specific wavelengths, providing values for Chl a, Chl b and Chl total in arbitrary units. Ten random points on each leaf were analyzed, ensuring comprehensive sampling of the entire leaf area. This procedure was repeated on nine leaves per treatment, totaling 90 points per treatment.
Assessment, quantification of damage, and membrane integrity loss
To evaluate the integrity of the plasma membrane and identify potential damage or ruptures caused by T. urticae, a histochemical analysis using Evans Blue dye was performed. This technique allowed us to detect structural changes associated with such alterations. Following the protocol established by Romero-Puertas et al. (2004), the leaves were initially detached and immersed in a 0.25% aqueous solution of Evans Blue for five hours. The dye can penetrate cells where the membrane has been ruptured, resulting in the staining of affected areas in blue. After immersion, the leaves were subjected to a decolorization process in boiling 99% ethanol for approximately 30 minutes, which allowed for the removal of chlorophyll and the highlighting of the blue spots for subsequent analysis. The leaves were then photographed using a digital camera, enabling the counting of the blue spots observed on the adaxial surface of the leaf. Only spots with intense blue coloration were considered for analysis. For each treatment, three plants were assessed, and three leaves were collected from each plant, totaling nine leaves per treatment.
Data analysis
All statistical analyses and graph production were conducted using the R statistical programming language (Ihaka and Gentleman 1996; R Core Team 2023).
Stomata
We conducted statistical analyses to examine the effect of mite infestation on leaves, considering the number of stomata as a function of mite density. For this analysis, we adjusted two Generalized Linear Models (GLMs): one with a Gaussian distribution and the other with a negative binomial distribution. These models were used to investigate whether the number of stomata (response variable) could be explained by the density of mites on the leaves (predictor variable).
Chlorophylls
Experiments were conducted to investigate the mean levels of Chl a, b and t in leaves in response to different treatments (C, T25, T50 and T100). Nine replicates were performed per treatment, totaling 36 observations per type of chlorophyll. We used a GLM for each analysis, where the response variable was the amount of chlorophyll (a, b or t), and the treatments (different mite densities) were considered as predictor variables. Before extracting the results from each of these analyses, two GLMs were generated: one using a Gaussian distribution family and the other using a negative binomial distribution. The objective was to assess which model best fit the data. These models were generated using the glm and glm.nb functions, respectively, which are standard functions in the R programming language. Model selection was performed by comparing the Akaike Information Criterion (AIC) values. The AIC is a measure that evaluates the quality of a statistical model, penalizing model complexity (number of parameters) to avoid overfitting. We used the AICctab function from the bbmle package (Bolker and R Core Team 2021) to compare the models, selecting the one with the lowest AIC value as the best fit for the data.
Additionally, when the global GLM model was significant, pairwise comparisons between different treatments (C, T25, T50, T100) were performed. For these comparisons, we used the emmeans function, adjusting the p-values by the False Discovery Rate (FDR) method, available in the emmeans package (Lenth 2016). This adjustment method is used to control the false discovery rate when performing multiple comparisons, ensuring the robustness of the results.
Perforations per leaf
Finally, statistical analyses were conducted to evaluate the impact of mite infestation on leaves, considering the number of perforations caused. However, the number of perforations can be influenced by the size of the affected leaf area. Therefore, we adjusted two Generalized Linear Models (GLMs) for the analysis: one with a Gaussian distribution and another with a negative binomial distribution. In these models, the number of perforations was used as the response variable, the different treatments (C, T25, T50, T100) as the predictor variable, and the leaf area was included as a weighting factor in the model to control for the effect of leaf area size on the number of perforations.
Results
Number of stomata
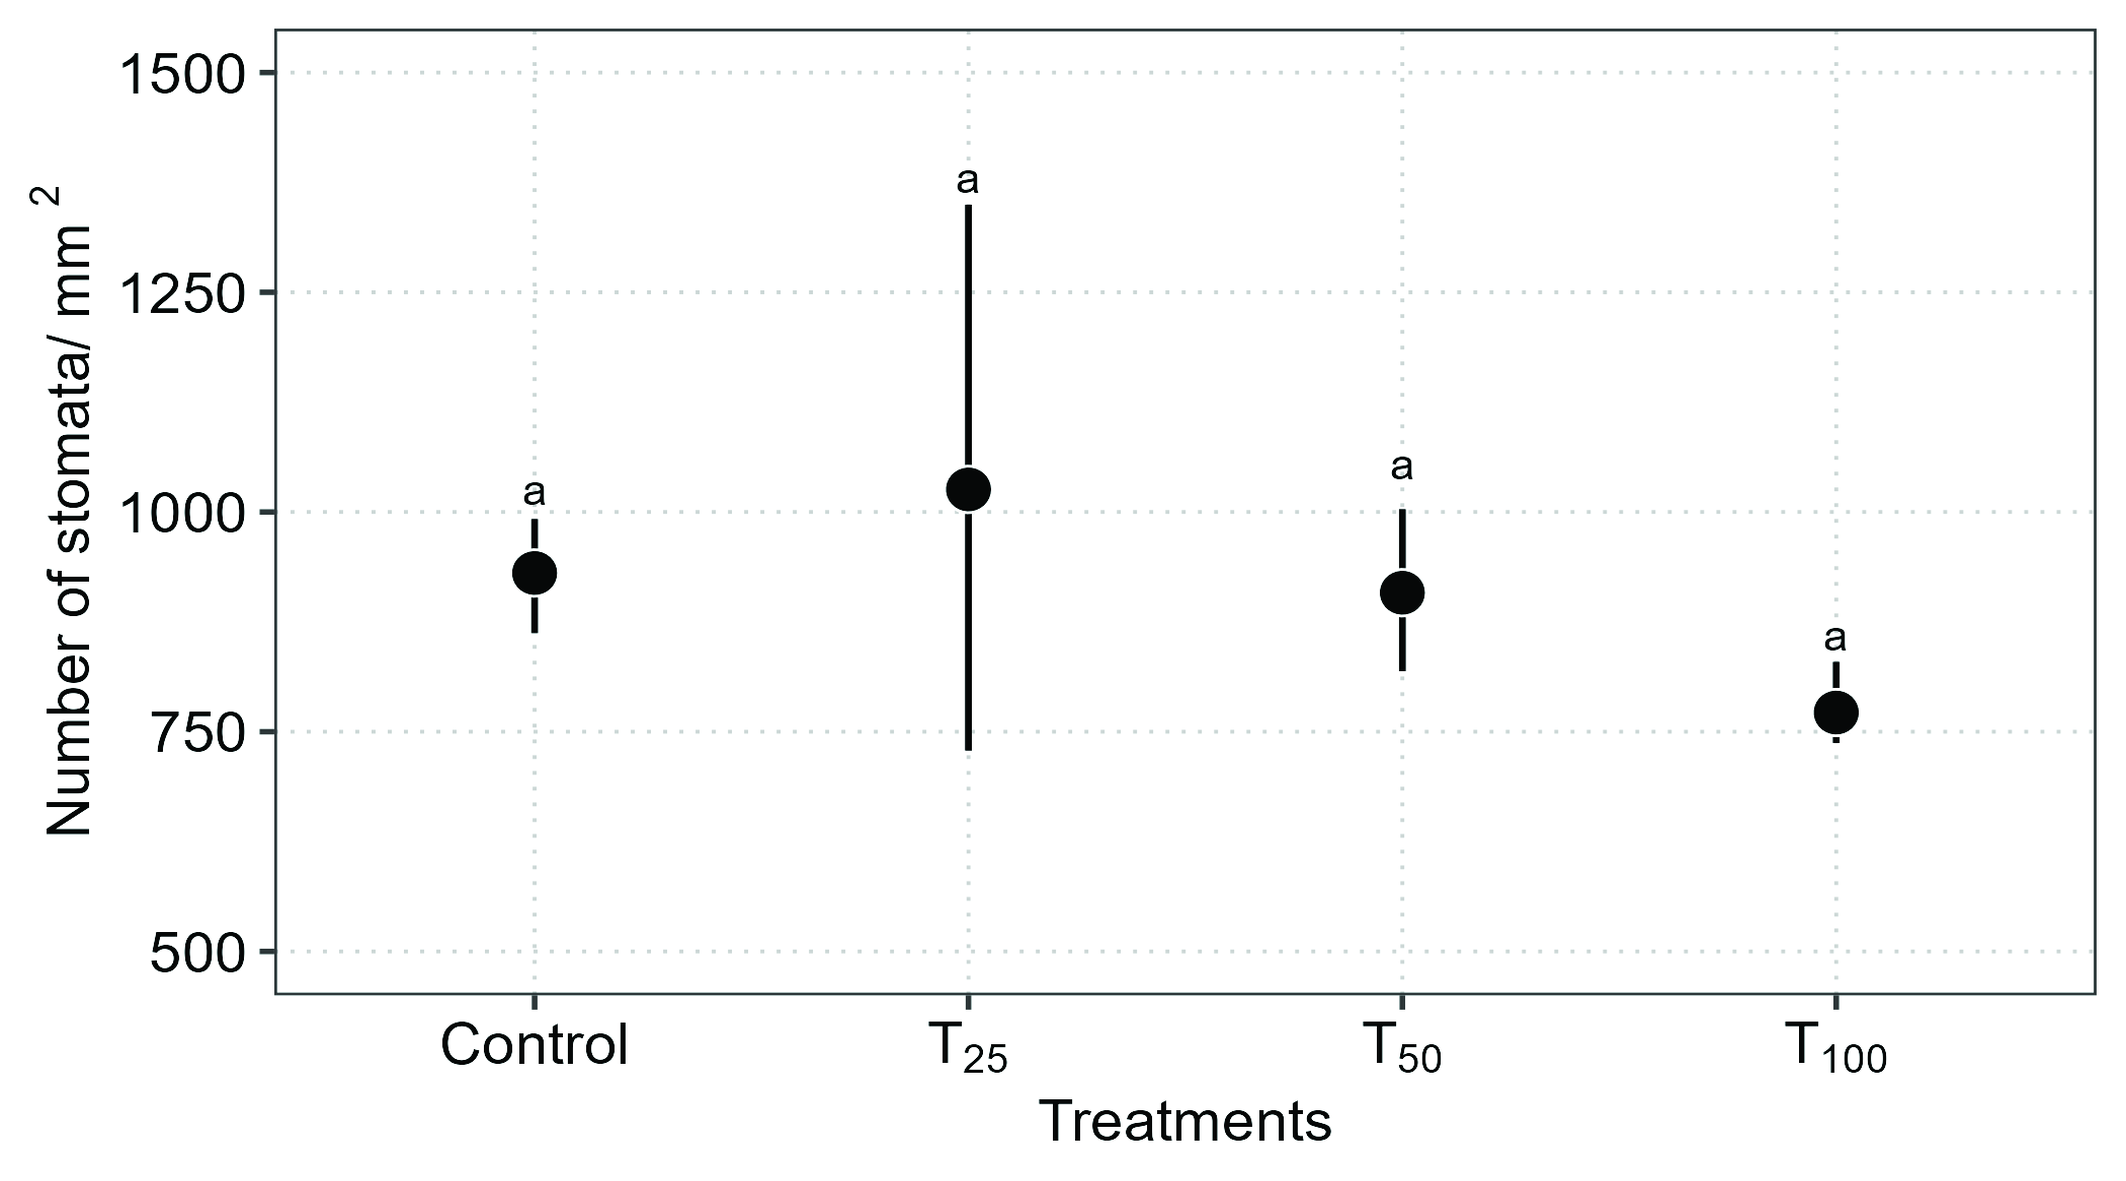
According to our statistical model, there was no significant difference in the number of stomata based on mite density on the leaves (Negative Binomial GLM: χ² = 4.92, DF = 3, P = 0.17) (Figure 1).
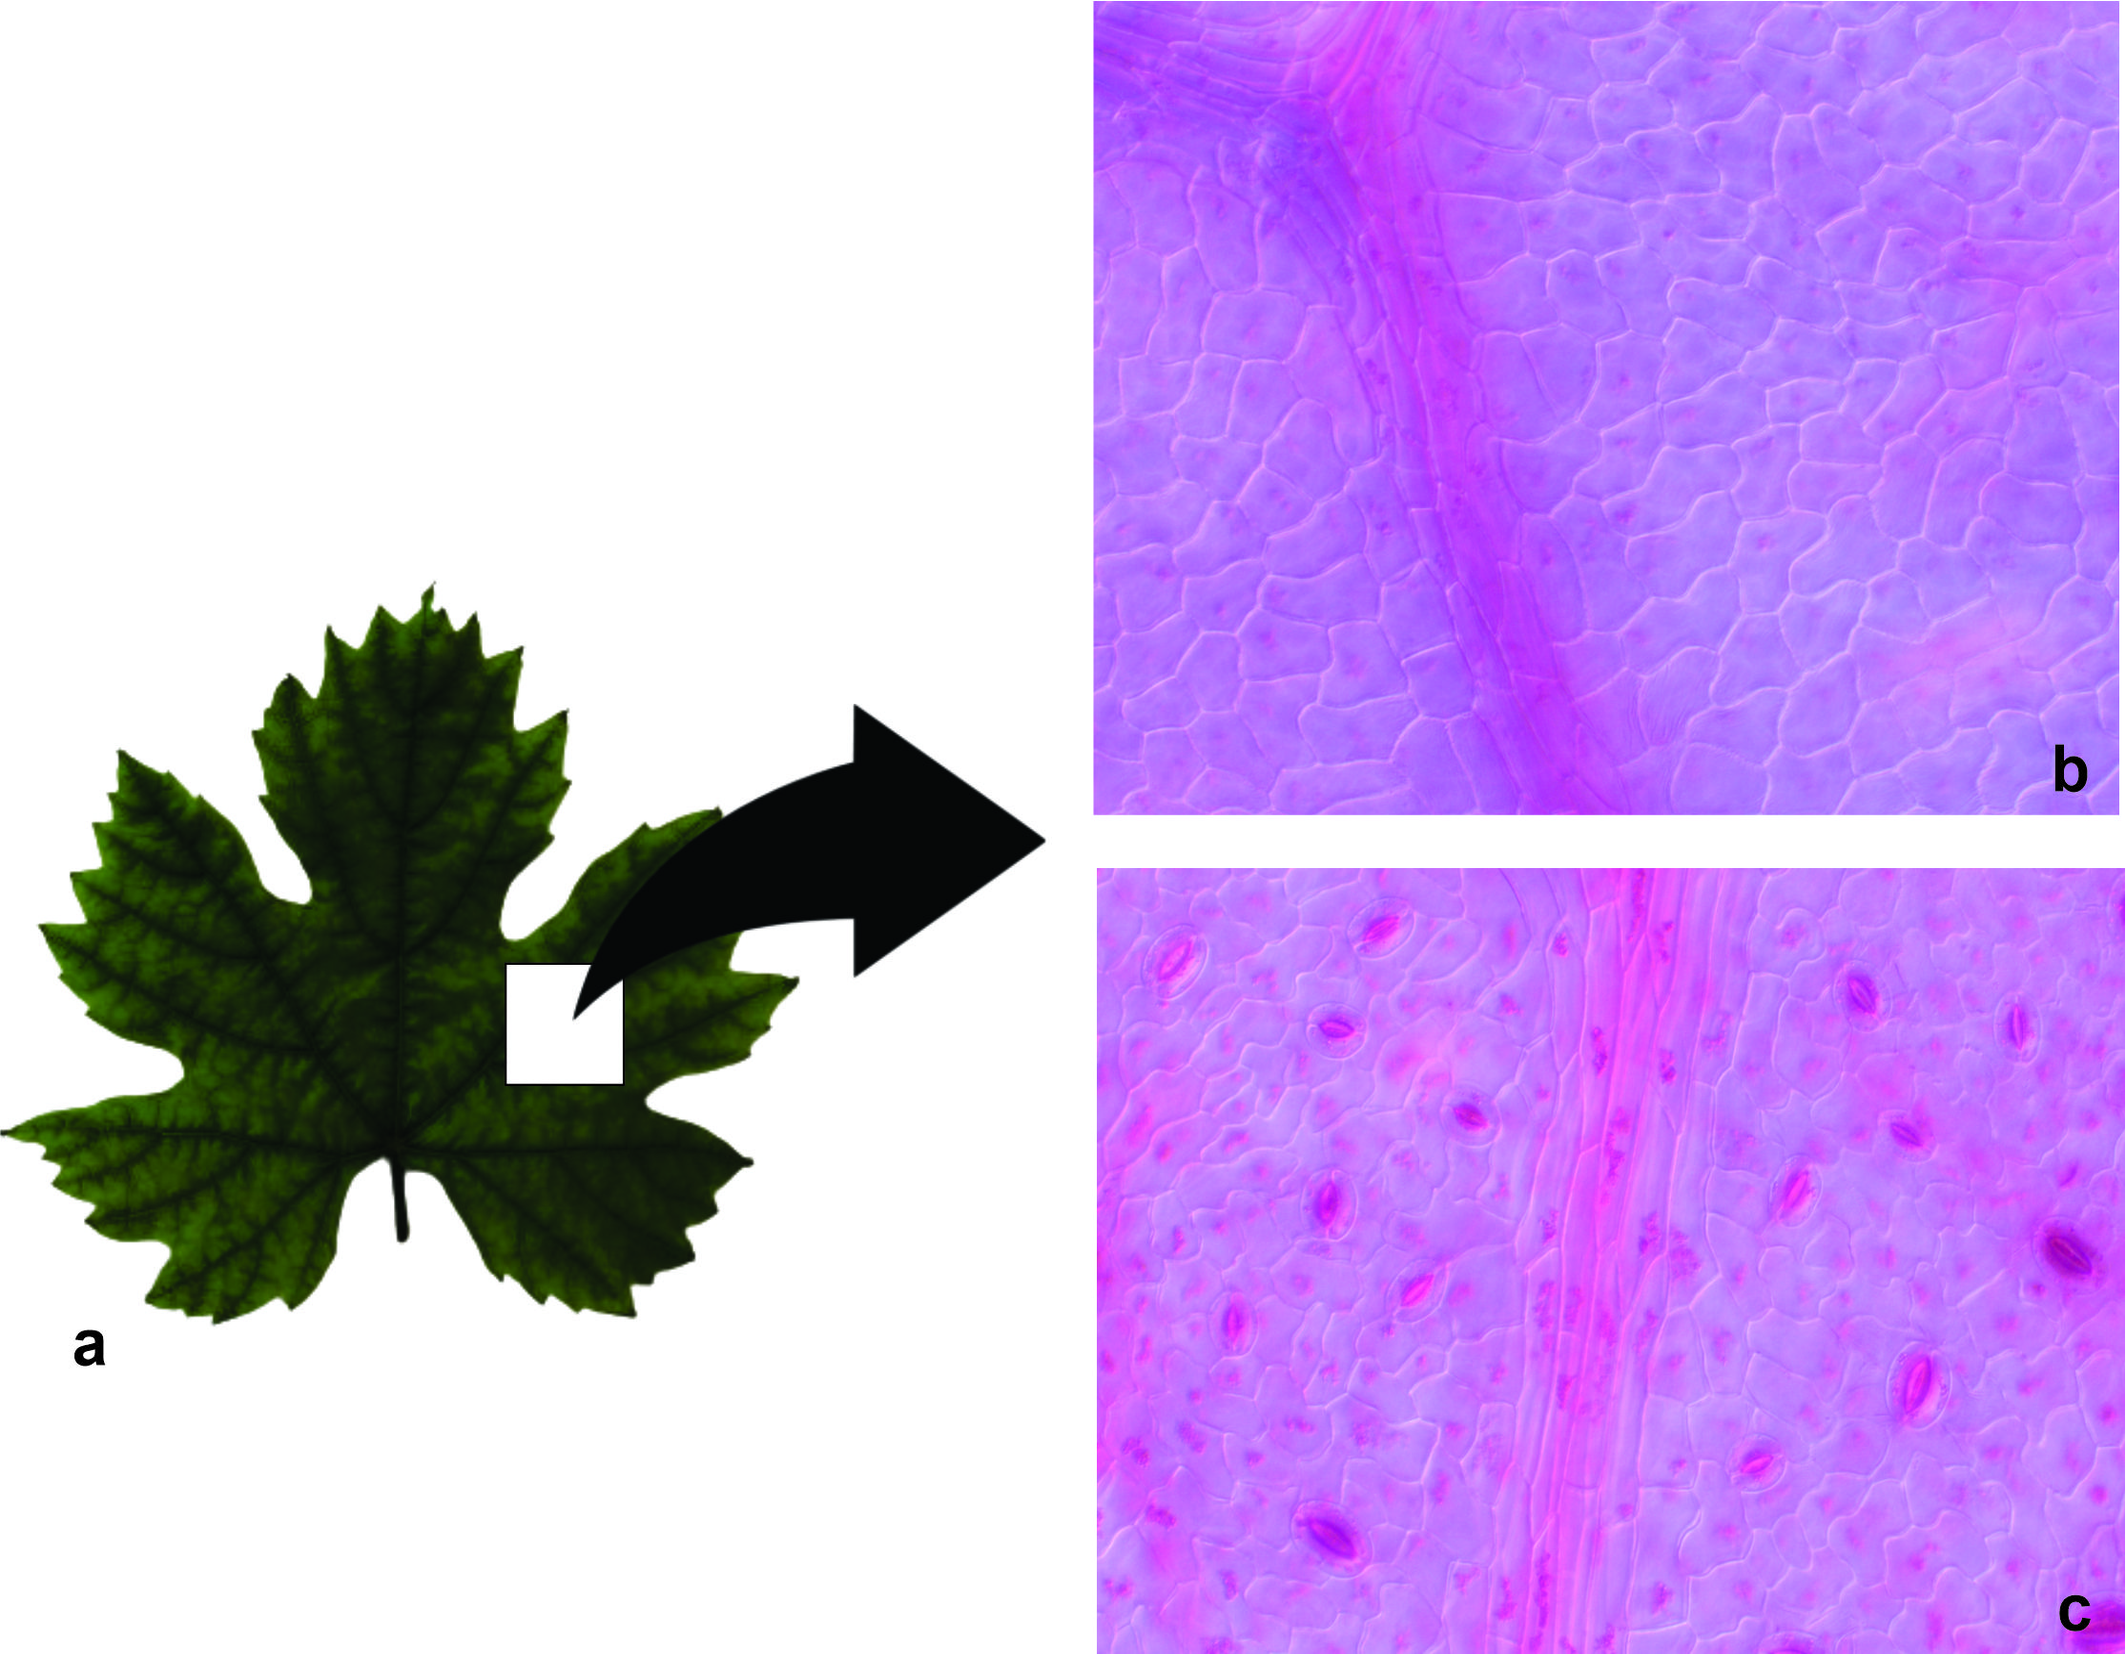
It should be noted that grapevine leaves (Vitis vinifera L.) have stomata exclusively on the lower epidermis (Figure 2c), and are absent on the adaxial surface (Figure 2b).
Chlorophylls versus mite density
The statistical model used to analyze the relationship between the average amount of Chl a and mite density on the leaves did not find a significant difference (Gaussian GLM: χ² = 3.75, DF = 3, P = 0.28) (Figure 3a). The average levels of Chl a by treatment indicate that, on average, in the absence of mites (Control), there is a tendency to have higher Chl a, with a mean of 19.9 (95% CI: 19.0–20.8), which does not statistically differ from the other treatments: T25 = 17.2 (95% CI: 16.3–18.1), T50 = 17.6 (95% CI: 16.2–19.0), and T100 = 19.0 (95% CI: 14.2–23.7).
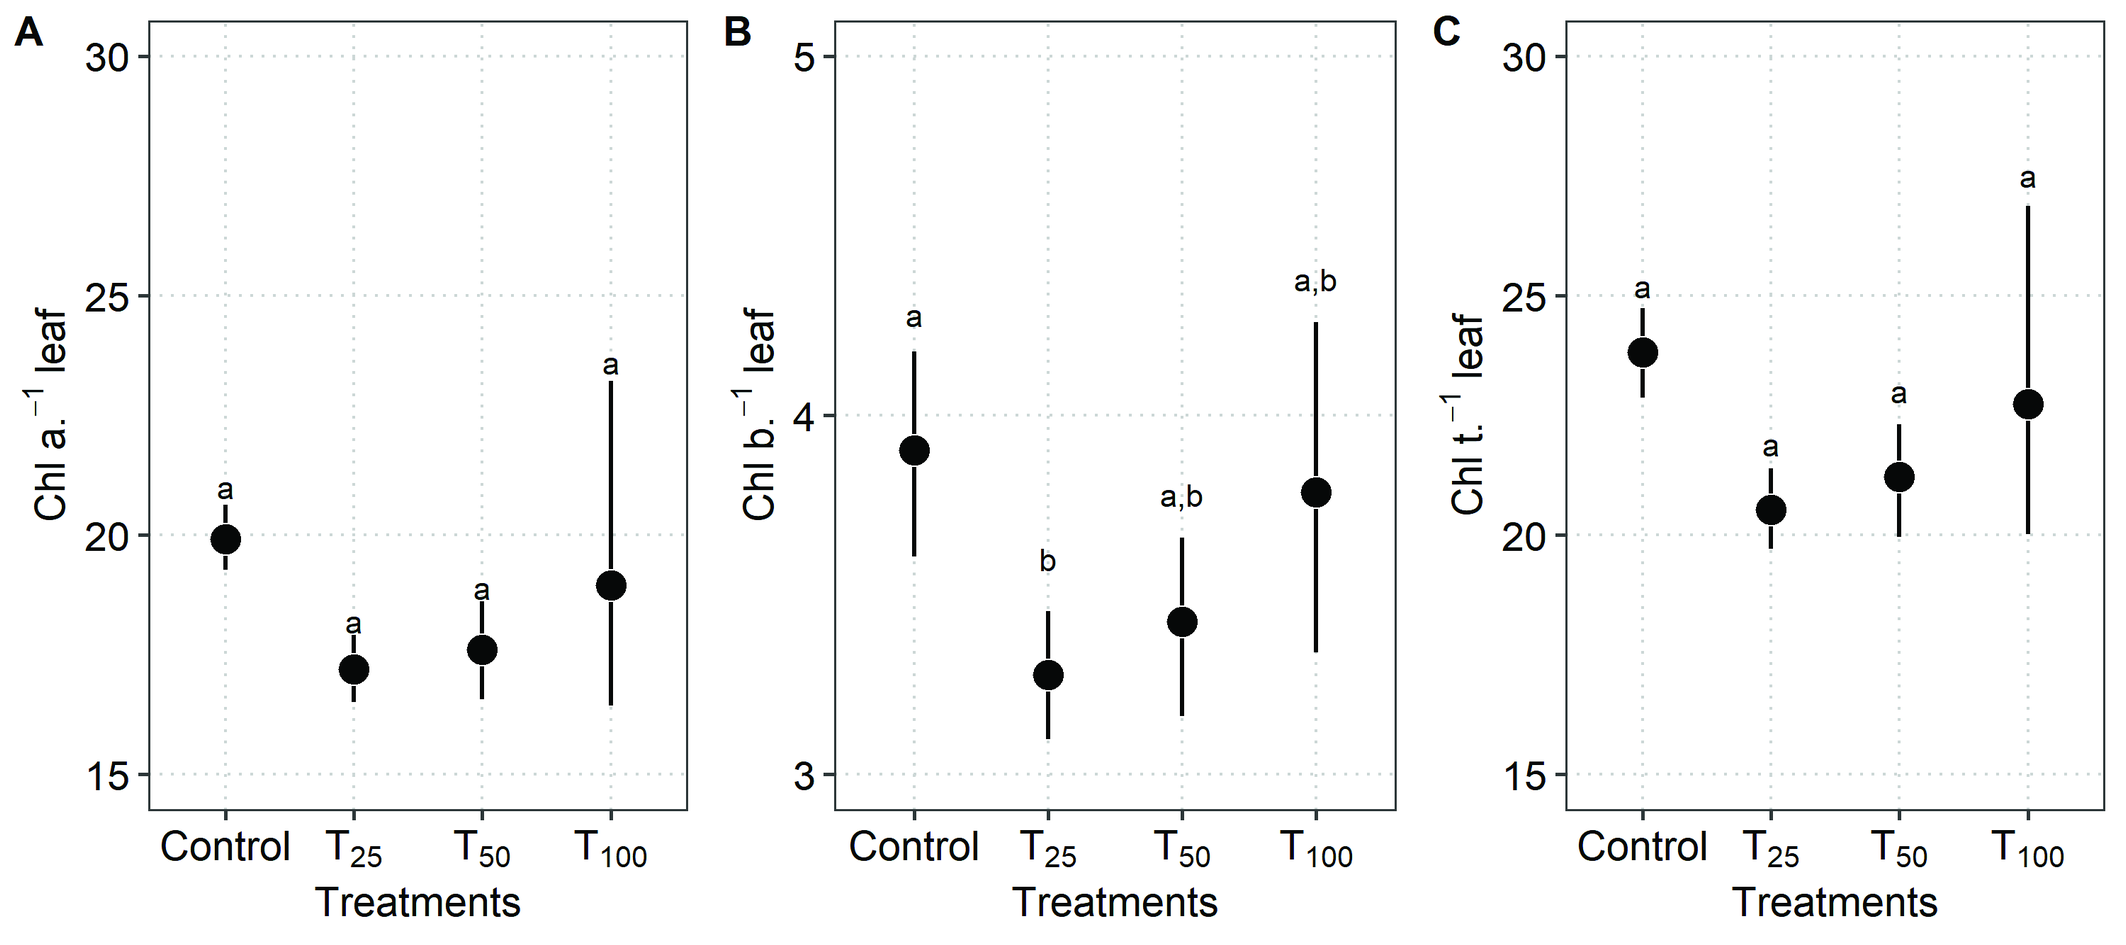
On the other hand, the average amount of Chl b in relation to mite density on the leaves was different (Gaussian GLM: χ² = 8.55, DF = 3, P = 0.03). Thus, on average, in the absence of mites (Control), there is a tendency to have higher Chl b, with a mean of 3.90 (IC 95%: 3.52–4.29). However, this difference was marginally significant when compared to T25, which had a mean of 3.28 (95% CI: 3.06–3.50) (Table 1). The average values for the other treatments were T50 = 3.43 (95% CI: 3.10–3.75) and T100 = 3.79 (95% CI: 3.20–4.38) (Figure 3b).
Download as
C
T25
T50
T25
0.07†
-
-
T50
0.24
0.93
-
T100
0.96
0.19
0.47
Finally, the average amount of Chl t in relation to mite density on the leaves showed no difference (Gaussian GLM: χ² = 5.27, DF = 3, P = 0.15). Although the average levels of Chl t suggest that, on average, the Control has a higher amount, with a mean of 23.8 (95% CI: 22.7 to 25.0), and no statistical difference when compared to the other treatments (Figure 3c). Once again, it was observed that T100 had high variability in the confidence intervals compared to the other treatments, which might obscure differences, especially between Control, T25, and T50.
Foliar perforations
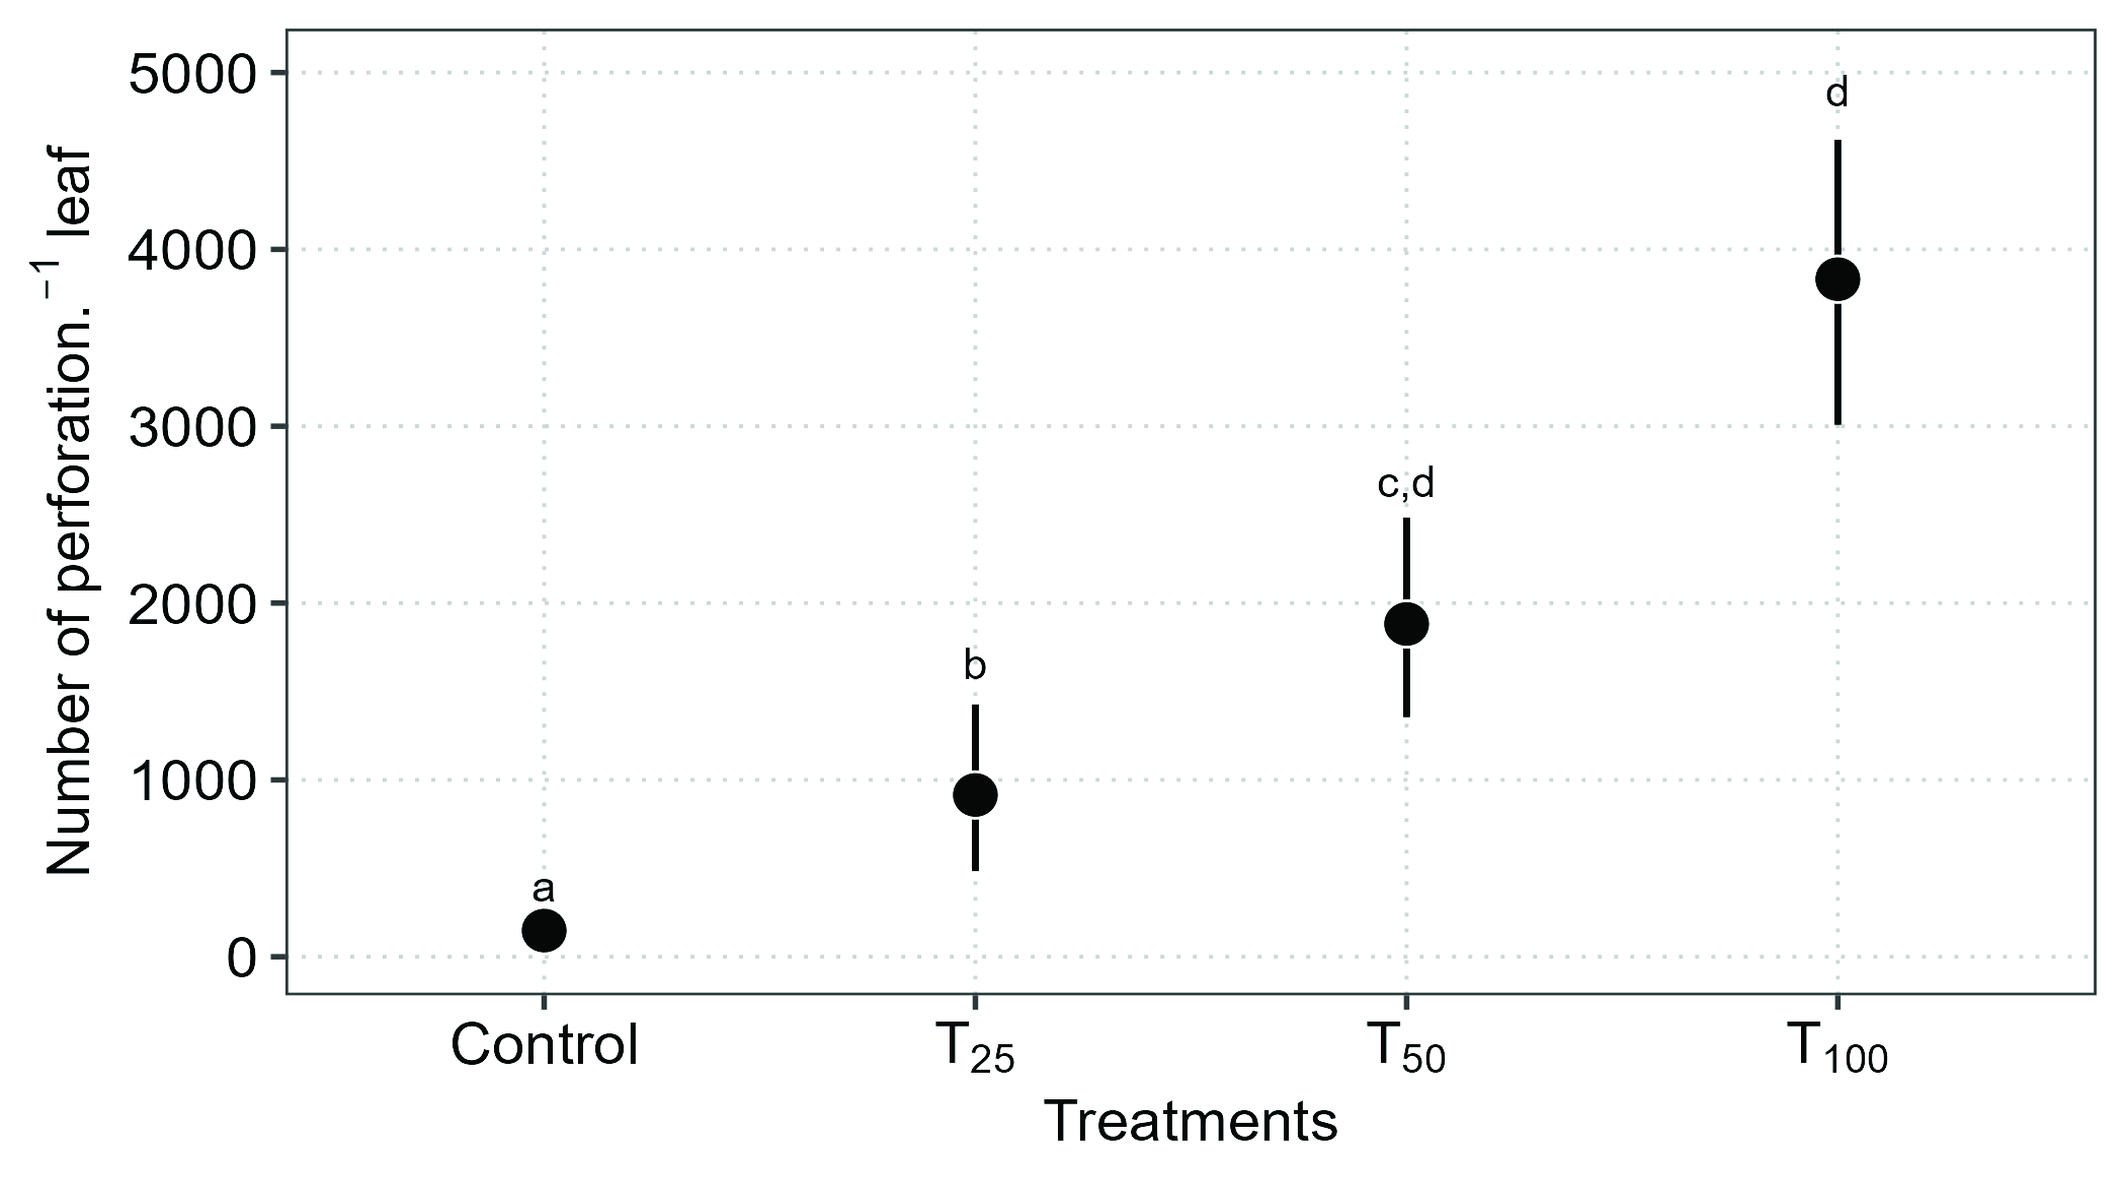
The analysis of the average number of perforations in leaves showed a significant effect based on mite density on the leaves (Gaussian GLM: χ² = 76.61, DF = 3, P < 0.001). In the pairwise analysis, it was observed that the differences were between the control treatment and all other treatments, as well as between the T25 treatment and both T50 and T100 (Table 2 and Figure 4).
Download as
C
T25
T50
T25
0.001***
-
-
T50
<0.001***
0.02**
-
T100
<0.001***
<0.001***
0.09†
The average leaf perforations indicate that when there are no mites (C), there is a tendency to have fewer perforations, with a mean of 148 (95% CI: 39.9–256). In contrast, the other treatments showed higher means: T25 = 556 (95% CI: 285–827), T50 = 915 (95% CI: 297–1532), and T100 = 3831 (95% CI: 2758–4905) (Figure 4).
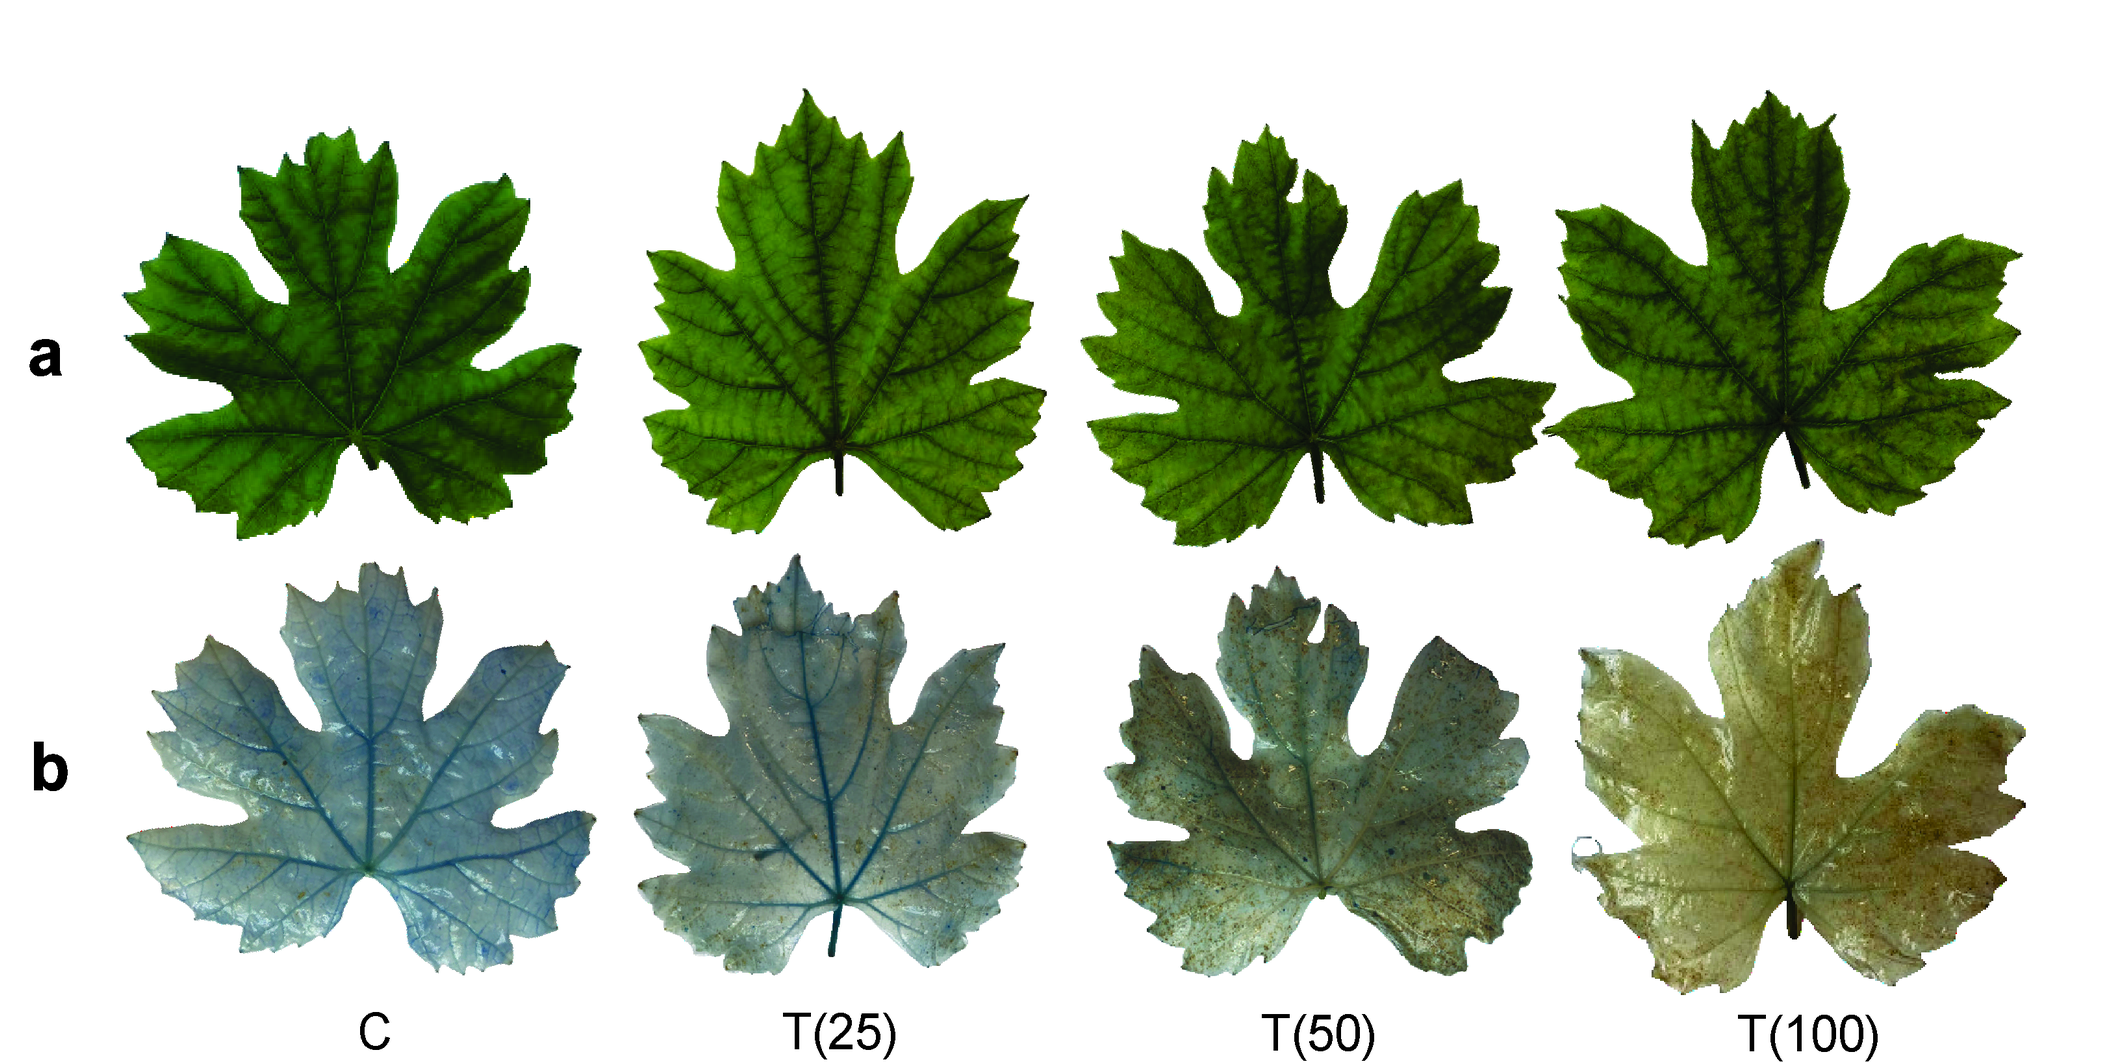
A change in the color of grapevine leaves was observed, shifting from vibrant green to brownish tones as the intensity of mite infestation increased (Figure 5a-b). This progressive darkening indicates the negative impact of mites on leaf health, likely related to chlorophyll degradation and damage to leaf tissues. The color change suggests that the physiological stress on the plant reflects a direct correlation between mite density and the decline in leaf vitality.
Discussion
Stomatal density varies between leaves, plants, and individuals of the same species, influenced by factors such as rootstock type, leaf position, precipitation, light intensity, and atmospheric CO₂ levels (Willmer and Fricker 1996; De Bem 2020). This interaction can significantly alter stomatal structure. Furthermore, stomatal density and its regulation in grapevines still require further research for a more comprehensive understanding (Rogiers et al. 2011).
In terms of stomatal morphology, Hetherington and Woodward (2003) identify two main types: bell-shaped stomata, typical of grasses, and kidney-shaped stomata. As expected, Chardonnay grapevines exhibited a hypostomatic leaf configuration, with stomata located exclusively on the abaxial surface and presenting a characteristic kidney shape, as previously illustrated. This distribution pattern is consistent with previous descriptions for V. vinifera, where stomata are found only on the lower epidermis (Monteiro et al. 2013; Boso et al. 2016). This pattern contributes to the efficient regulation of gas exchange and to the reduction of water loss through transpiration.
In the present study, no significant changes in stomatal density were observed in the Chardonnay cultivar subjected to mite infestation over an eight-day period, suggesting that stomatal density may not be a determining factor in the immediate response of grapevines to mites, at least in the short term. The limited duration of exposure may have been insufficient to induce noticeable morphological changes, as previously reported in prolonged infestations by Daktulosphaira vitifoliae Fitch (Hemiptera: Phylloxeridae), where alterations in stomatal density, including the formation of stomata on the adaxial leaf surface, were observed (Nabity et al. 2013).
Additionally, significant variation in stomatal density among grapevine cultivars has been reported, even under pathogen-free conditions. The Chardonnay cultivar, for example, exhibits high stomatal density, which may reflect specific genetic traits or physiological adaptations (Gómes-del-Campo et al. 2003; Teixeira et al. 2018; Odabasioglu and Gursoz, 2019; Espinoza et al. 2024). This configuration may be associated with increased susceptibility to pathogens, as shown by De Bem (2020), who reported higher infection rates by Plasmopara viticola (Berk. & Curt.) Berl. in V. vinifera cultivars with higher stomatal density, such as Solaris and Chardonnay. Conversely, more resistant cultivars such as Bronner and Jasmine exhibit lower stomatal density, which may represent an adaptive strategy to limit pathogen entry, since stomata act as entry points for microorganisms (Melotto et al. 2006; De Bem et al. 2020).
Stomatal density is regulated by a complex interaction of genetic factors, leaf morphology, and environmental conditions (Willmer and Fricker 1996). This structural plasticity is modulated by environmental signals, including climate variations, enabling plants to adjust leaf functions in response to changing environmental conditions (Hetherington and Woodward 2003; Du et al. 2021).
In our study, the average amount of chlorophyll Chl a did not show significant differences in relation to mite density, suggesting that Chl a may not be directly influenced by mites over a short exposure period. In contrast, the Chl b exhibited differences, with higher concentrations observed in mite-free conditions. This indicates that Chl b may be more sensitive to environmental conditions altered by mites, possibly due to its role in stabilizing chlorophyll-binding proteins.
Although the control treatment (C) shows apparently higher average levels of Chl t compared to the other treatments, the observed difference is not statistically significant. However, the reductions in photosynthetic pigments observed here can be attributed to the damage caused by mites, which compromise cellular content by extracting the cytoplasmic content from the cells (Nagaraj et al. 2002).
Our results are consistent with those of Iatrou et al. (1995), who reported up to a 50% reduction in total chlorophyll (Chl t) concentration after five days of T. urticae feeding, suggesting that longer or more intense infestations tend to cause significant declines in chlorophyll levels. Similarly, Zart et al. (2014) observed reductions of 43% in Chl t concentration and 45% in photosynthetic rate in seedlings infested by root weevils, highlighting the cumulative physiological impact of sustained biotic stress.
Studies involving T. urticae and Eotetranychus carpini borealis (Ewing) (Tetranychidae) on Rubus idaeus (L.) (Rosaceae) also reported no significant changes in photosynthetic parameters after two weeks of infestation, supporting the idea that such effects may depend on the duration and intensity of the attack (Bounfour et al. 2002). In contrast, Bois noir (BN) infection in Chardonnay led to a significant decrease in chlorophyll content (Lobato et al. 2009; Rusjan et al. 2012), as did infestations by Daktulosphaira vitifoliae Fitch (Blanchfield et al. 2006), and T. urticae herbivory in soybean at the end of the crop cycle (Park and Lee 2002). Gebler et al. (2022) and Costa et al. (2019) highlight that variations in chlorophyll content can be influenced by factors such as leaf structure and anatomy, phenological stage, leaf position and age on the plant, general plant condition, and year of assessment, among other aspects.
Given that changes in pigment composition can be detected before visible alterations in the leaves (Blanchfield et al. 2006), the results highlight the complexity of mite infestation effects on plant physiology. They suggest that damage caused by mites may become more pronounced over the long term, with cumulative effects on chlorophyll content and photosynthetic efficiency. Early cellular damage that affects the plastoquinone pool (QA), essential for electron transport during photosynthesis, may impair photosynthetic efficiency (Silva et al. 2024) before changes in chlorophyll or other photosynthetic indicators become visible. Therefore, continuous monitoring of chlorophyll, especially Chl b, in Chardonnay could be crucial for accurately assessing mite-induced stress and developing more effective management strategies.
Cell membrane damage is frequently observed in plants (Souza and Barbosa 2015) and results from both biotic and abiotic stresses, reflecting the cell's ability to withstand adverse environmental conditions. The integrity of the membrane is crucial for maintaining cellular homeostasis, and structural changes can indicate stress-induced cellular damage or death, as described by Vijayaraghavareddy et al. (2017). In the present study, the insertion of the mouthparts of T. urticae into the plant leaves caused visible damage to the cell membrane.
In this study, a notable change in leaf coloration with increasing phytophagous populations was observed, providing important insights into the impact of mites on plant physiology. Initially, the attack by tetranychids results in a whitish coloration of the leaves. This phenomenon is caused by cellular depletion and the removal of chloroplasts (Roggia et al. 2008), which compromises the photosynthetic capacity of the leaves. As damage progresses, the leaves tend to turn yellow and eventually brown. This color change reflects the oxidation of the affected areas, confirming the observations of Roggia et al. (2008). Such color changes not only reflect the severity of mite infestation but also provide insight into the pathological mechanisms affecting overall plant health. Analyzing cell viability and identifying dead cells are essential to understanding these host-pathogen interactions (Baker and Mock, 1994).
In contrast, Raoiella indica Hirst (Acari: Tenuipalpidae) employs a distinct feeding strategy by inserting its stylets into the stomata to access the mesophyll, thereby avoiding direct penetration of the cuticle or epidermal cells (Ochoa et al. 2011). This divergence highlights the functional diversity among phytophagous mites and the complexity of their interactions with host plants (Ochoa et al. 2011; Bensoussan et al. 2016). Our results demonstrated a significant correlation between the number of leaf perforations and mite density, confirming the observations made by Nabity et al. (2009). This pattern indicates that infestation intensity can be assessed by the extent of visible damage, which compromises the structural integrity of the leaf. Furthermore, the loss of leaf tissue represents a direct reduction in photosynthetic capacity, while damage to the leaf veins may impair both hydraulic and stomatal conductance, negatively affecting photosynthesis and intensifying physiological stress in infested plants (Nabity et al. 2009)
Blasi et al. (2017) suggest significant loss of membrane stability and cell death in rice plants (Oryza sativa L.; Poaceae) infested by Schizotetranychus oryzae Rossi de Simons (Tetranychidae). According to the same authors, severe infestations can cause similar cellular damage in various crops. These findings underscore the importance of mite population density as a critical indicator of leaf damage severity. Thus, the observed correlation between mite density and leaf damage provides a solid foundation for developing more effective monitoring and control methods, which are essential for pest management in agricultural crops.
Nabity et al. (2009) highlight that herbivory can reduce leaf area and impair leaf function, negatively impacting plant yield and productivity. The presence of phytophages, whether through defoliation or feeding on specific tissues such as phloem or xylem, triggers a complex and interactive response in plants. These responses include molecular and physiological changes that can diminish the photosynthetic capacity of the remaining leaf tissues, extending beyond the effects of mere removal of the photosynthetic surface. Additionally, the aggressiveness of the species can be a significant factor, as cells adjacent to those directly damaged may exhibit mild symptoms (Park and Lee 2002). In the case of T. urticae, as described by Roggia et al. (2008), the attack leads to the appearance of yellowish spots on both the adaxial and abaxial surfaces of the leaves, which eventually evolve into a bronzed coloration, a pattern also observed in our study. Over time, the affected leaves become dry and fall off.
Conclusion
We conclude that the herbivory of T. urticae has significant adverse impacts on Chardonnay health, highlighting that mite density and the number of leaf punctures are critical indicators of damage. Our results indicate that the phytophagous not only compromise leaf area integrity but also trigger physiological responses that reduce photosynthetic capacity and, consequently, plant productivity. Extending the infestation period to one month, allowing mites to complete a full life cycle, is recommended to observe the prolonged plant response to stress and to gain a more detailed understanding of the plant's defense capacity and the overall impacts of the infestation.
Additionally, we suggest conducting studies on protein-protein interactions to deepen the understanding of plant defense mechanisms, revealing how specific proteins collaborate in the response to mite attacks and elucidating the signaling networks involved.
Credit authorship contribution statement
Aline Marjana Pavan: Conceptualization, Formal analysis, Investigation, Methodology, Writing – original draft. Tairis Da-Costa: Conceptualization, Formal analysis, Investigation, Methodology, Writing – original draft. Luiza Picoli Ribeiro: Investigation, Methodology. Noeli Juarez Ferla: Conceptualization, Methodology, Resources, Supervision, Writing – review and editing.
Declaration of competing interest
The authors declare that they have no known competing financial interests or personal relationships that could have appeared to influence the work reported in this paper.
Data availability
Data will be made available on request.
Acknowledgments
We are grateful to Luana Fabrina Rodighero for help with experiments. The authors would like to thank Universidade do Vale do Taquari – Univates for providing all the necessary material for this study and the Conselho Nacional de Desenvolvimento Científico e Tecnológico (CNPq) for the Research Productivity Scholarship granted to the NJF (CNPq nº 310146/2023-2). This study was partially financed by the Coordenação de Aperfeiçoamento de Pessoal de Nível Superior - Brasil (CAPES) – Financial Code 001.
References
- Arruda D.C., Ducati J.R., Pithan P. A., Thum A.B., Hoff R. 2024. Hyperspectral data analysis for chlorophyll content derivation in vineyards. Ciência Rural, 54. https://doi.org/10.1590/0103-8478cr20220558
- Baker J.C., Mock N.M. 1994. An improved method for monitoring cell death in cell suspension and leaf disc assays using Evans blue. Plant Cell, Tissue and Organ Culture, 39: 7-12. https://doi.org/10.1007/BF00037585
- Bensoussan N., Santamaria M.E., Zhurov V., Diaz I., Grbić M., Grbić V. 2016. Plant-herbivore interaction: dissection of the cellular pattern of Tetranychus urticae feeding on the host plant. Frontiers in plant science, 7: 1105. https://doi.org/10.3389/fpls.2016.01105
- Blanchfield A.L., Robinson S.A., Renzullo L.J., Powell K.S. 2006. Phylloxera-infested grapevines have reduced chlorophyll and increased photoprotective pigment content-can leaf pigment composition aid pest detection? Functional Plant Biology, 33: 507-514. https://doi.org/10.1071/FP05315
- Blasi É.A.R., Buffon G., Rativa A.G.S., Lopes M.C.B., Berger M., Santi L., Lavallée-Adam M., Yates J.R., Schwambach J., Beys-da-Silva W.O., Sperotto R.A. 2017. High infestation levels of Schizotetranychus oryzae severely affects rice metabolism. Journal of Plant Physiology, 219: 100-111. https://doi.org/10.1016/j.jplph.2017.10.005
- Bolker B., R Core Team. 2021. bbmle: Tools for general maximum likelihood estimation. https://cran.r-project.org/web/packages/bbmle/index.html
- Boso S., Gago P., Alonso-Villaverde V., Santiago J.L., Martinez M.C. 2016. Density and size of stomata in the leaves of different hybrids (Vitis sp.) and Vitis vinifera varieties. Vitis, 55: 17-22.
- Botton M., Afonso A.P., Ringenberg R. 2003. Manejo de pragas na cultura da videira. Seminário Interestadual de Fruticultura, 3: 23-31.
- Botton M., Arioli C.J., Junior R.M. 2015. Manejo de Pragas. In: Garrido L.R., Hoffmann A., Silveira S.V. (Eds) Produção integrada de uva para processamento: manejo de pragas e doenças. Brasília: Embrapa. p. 85.
- Bounfour M., Tanigoshi L. K., Chen C., Cameron S. J., Klauer S. 2002. Chlorophyll content and chlorophyll fluorescence in red raspberry leaves infested with Tetranychus urticae and Eotetranychus carpini borealis (Acari: Tetranychidae). Environmental Entomology 31: 215-220. https://doi.org/10.1603/0046-225X-31.2.215
- Bowers, J., Boursiquot, J.M., This, P., Chu, K., Johansson, H., Meredith, C. 1999. Historical genetics: the parentage of Chardonnay, Gamay, and other wine grapes of northeastern France. Science, 285: 1562-1565. https://doi.org/10.1126/science.285.5433.1562
- Costa B.R., Oldoni H., Silva W.A., Martins R. L., Bassoi, L.H. 2019. Temporal variation and spatial distribution of relative indices of leaf chlorophyll in grapevine cv. Chardonnay. Engenharia Agrícola, 39: 74-84. https://doi.org/10.1590/1809-4430-eng.agric.v39nep74-84/2019
- Chacón-Hernández J.C., Camacho-Aguilar I., Cerna-Chavez E., Ordaz-Silva S., Ochoa-Fuentes Y. M., Landeros-Flores J. 2018. Effects of Tetranychus urticae and Phytoseiulus persimilis (Acari: Tetranychidae: Phytoseiidae) on the chlorophyll of rosal plants (Rosa sp.). Agrociência, 52: 895-909.
- De Araújo W.S., Daud R.D. 2018. Insights on plant mite occurrence in natural vegetation remnants from Brazil. Systematic and Applied Acarology, 22: 302-322. https://doi.org/10.11158/saa.23.8.10
- De Bem, B.P.D., Bogo A., Brighenti A. F., Wruz D. A., Allebrandt R., Stefanini M., Rufato L. 2020. Dinâmica temporal do míldio da videira em variedades Piwi na região de San Michele all′Adige, Trentino-Itália. Summa Phytopathologica, 46:212-220. https://doi.org/10.1590/0100-5405/230013
- Du B., Zhu Y., Kang H., Liu C. 2021. Spatial variations in stomatal traits and their coordination with leaf traits in Quercus variabilis across Eastern Asia. Science of the Total Environment, 789: 147757. https://doi.org/10.1016/j.scitotenv.2021.147757
- Espinoza S., Ortega-Farías S., Ahumada-Orellana L. 2024. Characterization of stomatal density and size of different Vitis vinifera L. cultivars growing in Mediterranean climate conditions. Ciência e Técnica Vitivinícola, 39: 196-208. https://doi.org/10.1051/ctv/ctv2024390114
- Ferla N.J., Botton M. 2008. Ocorrência do ácaro vermelho europeu Panonychus ulmi (Koch) (Tetranychidae) associado à cultura da videira no Rio Grande do Sul, Brasil. Ciência Rural, 38: 1758-1761. https://doi.org/10.1590/S0103-84782008000600042
- Flechtmann C.H.W. 1983. Ácaros de importância agrícola. São Paulo: Livraria Nobel. pp. 189.
- Gebler L., Ferreira R.A., Amaral L.P., Carvalho L.F.D., Silva J.R., Celmer A.F., Fogaça A.O., Amado T.J.C. 2022. Variabilidade espacial do teor relativo de clorofila em videiras na Vinícola Velho Amâncio. In: Congresso Brasileiro De Fruticultura, Encontro Nacional Sobre Fruticultura De Clima Temperado. Florianópolis: Epagri.
- Gómez-del-Campo M., Ruiz C., Baeza P., Lissarrague J.R. 2003. Drought adaptation strategies of four grapevine cultivars (Vitis vinifera L.): modification of the properties of the leaf area. Journal International des Sciences de la Vigne et du Vin, 37: 131-143. https://doi.org/10.20870/oeno-one.2003.37.3.950
- Hetherington A.M., Woodward F.I. 2003. The role of stomata in sensing and driving environmental change. Nature, 424: 901-908. https://doi.org/10.1038/nature01843
- Iatrou G., Cook C.M., Stamou G., Lanaras T. 1995. Chlorophyll fluorescence and leaf chlorophyll content of bean leaves injured by spider mites (Acari: Tetranychidae). Experimental & Applied Acarology, 19: 581-591. https://doi.org/10.1007/BF00048813
- Ihaka R., Gentleman R. 1996. R: a language for data analysis and graphics. Journal of Computational and Graphical Statistics, 5: 299-314. https://doi.org/10.2307/1390807
- Johann L., Horn T.B., Carvalho G.S., Ferla N.J. 2014. Diversity of mites (Acari) in vineyard agroecosystems (Vitis vinifera) in two viticultural regions of Rio Grande do Sul state, Brazil. Acarologia, 54: 137-154. https://doi.org/10.1051/acarologia/20142122
- Kemerich G.T., Johann L., Silva D.E., Ferla N. J., Souza C.F.V. 2022. Effect of mite biological control on the physicochemical properties and bioactive compounds profile in grapes of Merlot variety. Phytoparasitica, 50: 1-11. https://doi.org/10.1007/s12600-021-00973-1
- Landeros J., Guevara L.P., Badii M.H., Flores A.E., Pámanes A. 2004. Effect of different densities of the twospotted spider mite Tetranychus urticae on CO2 assimilation, transpiration, and stomatal behaviour in rose leaves. Experimental & Applied Acarology, 32: 187-198. https://doi.org/10.1023/B:APPA.0000021788.07667.6b
- Lenth R.V. 2016. Least-squares means: The R package lsmeans. Journal of Statistical Software 69: 1-33. https://doi.org/10.18637/jss.v069.i01
- Lobato A.K.S., Gonçalves-Vidigal M.C., Filho, P.S.V., Costa R.C.L., Cruz F.J.R., Santos C.R., Silva L.L., Sousa L.L. 2009. Changes in photosynthetic pigment and carbohydrate content in common bean cultivars infected by Colletotrichum lindemuthianum. Plant, Soil and Environment, 55: 58-61. https://doi.org/10.17221/259-PSE
- Marini R.P., Pfeiffer D.G., Sowers D.S. 1994. Influence of European red mite (Acari: Tetranychidae) and crop density on fruit size and quality and on crop value of ′Delicious' apples. Journal of Economic Entomology, 87: 1302-1311. https://doi.org/10.1093/jee/87.5.1302
- Mello L.M.R. 2013. Vitivinicultura Brasileira: panorama 2012. [Internet]. [05 july 2024]. Bento Gonçalves: Embrapa Uva e Vinho. Available from: https://www.infoteca.cnptia.embrapa.br/infoteca/bitstream/doc/961580/1/cot137.pdf
- Melotto M., Underwood W., Koczan J., Nomura K., He S.Y. 2006. Plant stomata function in innate immunity against bacterial invasion. Cell, 126: 969-980. https://doi.org/10.1016/j.cell.2006.06.054
- Monteiro L.B. 2002. Manejo integrado de pragas em macieira no Rio Grande do Sul II: uso de Neoseiulus californicus para o controle de Panonychus ulmi. Revista Brasileira de Fruticultura, 24: 395-405. [Internet]. [14 August 2024]. https://doi.org/10.1590/S0100-29452002000200024
- Monteiro A., Teixeira G., Lopes C.M. 2013. Comparative leaf micromorphoanatomy of Vitis vinifera ssp. vinifera (Vitaceae) red cultivars. Ciência e Técnica Vitivinicola, 28: 19-28.
- Moraes G.J., Flechtmann C.H.W. 2008. Manual de acarologia: acarologia básica e ácaros de plantas cultivadas no Brasil. Ribeirão Preto: Holos. 288 pp.
- Nabity P.D., Zavala J. A., Delucia E.H. 2009. Indirect suppression of photosynthesis on individual leaves by arthropod herbivory. Annals of botany, 103: 655-663. https://doi.org/10.1093/aob/mcn127
- Nabity P.D., Haus M.J., Berenbaum M.R., DeLucia, E.H. 2013. Leaf-galling phylloxera on grapes reprograms host metabolism and morphology. Proceedings of the National Academy of Sciences, 110: 16663-16668. https://doi.org/10.1073/pnas.1220219110
- Nagaraj N., Reese J.C., Kirkham M.B., Kofoid K., Campbell L. R., Loughin, T. M. 2002. Relationship between Chlorophyll Loss and Photosynthetic Rate in Greenbug (Homoptera: Aphididae) Damaged Sorghum. Journal of the Kansas Entomological Society, 75: 101-109.
- Ochoa R., Beard J.J., Bauchan G.R., Kane E.C., Dowling A.P.G., Erbe E.F. 2011. Herbivore exploits chink in armor of host. American Entomologist, 57: 26-29. https://doi.org/10.1093/ae/57.1.26
- Odabasioglu M.I., Gursoz S. 2019. Leaf and stomatal characteristics of grape varieties (Vitis Vinifera L.) cultivated under semi-arid climate conditions. Fresenius Environmental Bulletin, 28: 8501-8510.
- Oliveira J.E.M., Paranhos B.A.J. 2021. Uva de Mesa - Ácaros [Internet]. Embrapa Semiárido. Available from: https://www.embrapa.br/agencia-de-informacao-tecnologica/cultivos/uva-de-mesa/producao/pragas/acaros#: :text=Sintomas%20do%20ataque%20de%20%C3%A1caro,crescimento%20ou%20atrofiamento%20dos%20ramos.
- Park Y.L., Lee J.H. 2002. Leaf cell and tissue damage of cucumber caused by twospotted spider mite (Acari: Tetranychidae). Journal of economic entomology, 95: 952-957. https://doi.org/10.1093/jee/95.5.952
- Pohlmann V., Lago I., Lopes S.J., Martins, J.T.D.S., Rosa, C.A., Caye M., Portalanza D. 2021. Estimation of common bean (Phaseolus vulgaris) leaf area by a non-destructive method. Semina: Ciências. Agrárias, 42: 2163-2180. https://doi.org/10.5433/1679-0359.2021v42n4p2163
- Prazaru S.C., Dal Mas G., Padoin M., Rizzardo D., Meggio F., Pitacco, A., Pozzebon A., Duso C. 2023. Effect of Leaf Removal and Insecticide Applications on Population Densities of Leafhoppers and Mites Associated with Grapevines. Insects, 14: 791. https://doi.org/10.3390/insects14100791
- R Core Team. 2023. R: A language and environment for statistical computing. The R Foundation for Statistical Computing, Vienna, Austria. Available from: https://cran.r-project.org/
- Ramos F. T., Ferreira L.S., Pivetta F., Maia J.C.S. 2015. Área do limbo foliar de diferentes plantas estimada por medidas lineares e matéria seca, calibradas com o software imagej. Interciencia, 40: 570-575.
- Rizzon L.A., Miele A., Scopel, G. 2009. Características analíticas de vinhos Chardonnay da Serra Gaúcha. Ciência Rural, 39: 2555-2558. https://doi.org/10.1590/S0103-84782009005000174
- Roggia S., Guedes J.V.C., Kuss R.C.R., Arnemann J.A., Návia D. 2008. Spider mites associated to soybean in Rio Grande do Sul, Brazil. Pesquisa Agropecuária Brasileira, 43: 295-301. https://doi.org/10.1590/S0100-204X2008000300002
- Rogiers S.Y., Hardie W.J., Smith J.P. 2011. Stomatal density of grapevine leaves (Vitis vinifera L.) responds to soil temperature and atmospheric carbon dioxide. Australian Journal of Grape and Wine Research, 17: 147-152. https://doi.org/10.1111/j.1755-0238.2011.00124.x
- Romagna A. 2018. Manejo da área foliar na qualidade da uva e características sensoriais do vinho cv. Chardonnay (Vitis vinifera L.) cultivada na Serra Gaúcha. 2018. [Dissertação Mestrado] Universidade de Caxias do Sul: Programa de Pós-Graduação em Biotecnologia. pp.104.
- Romero‐Puertas M.C., Rodríguez‐Serrano M., Corpas F.J., Gomez M.D., Del Rio L.A., Sandalio L.M. 2004. Cadmium‐induced subcellular accumulation of O2·− and H2O2 in pea leaves. Plant, Cell & Environment, 27: 1122-1134. https://doi.org/10.1111/j.1365-3040.2004.01217.x
- Rusjan D., Halbwirth H., Stich K., Mikulič-Petkovšek, M., Veberič R. 2012. Biochemical response of grapevine variety ′Chardonnay′ (Vitis vinifera L.) to infection with grapevine yellows (Bois noir). European Journal of Plant Pathology, 134: 231-237. https://doi.org/10.1007/s10658-012-9988-2
- Silva A., Souza J.M., Pádua G.M.S., Santosa A.C.R., Vasconcelos L.G., Dall′Oglioa E.L., Belleteb B.S., Veigac T.A.M., Vieira L.C.C., Sampaio O.M. 2024. Inibidores do Fotossistema II: uma perspectiva aleloquímica. Química Nova, 47: 1-11. https://doi.org/10.21577/0100-4042.20230097
- Silva S.P., Viana J.G.A., Moraes M.R.E. 2018. O mercado vitivinícola Brasileiro: uma análise a partir do comércio exterior. Brazilian Journal of Development, 4: 2059-2080. https://doi.org/10.34117/bjdv4n5-237
- Soria S.J., Dal Conte A.F. 2005. Bioecologia e controle das pragas da videira. [Internet]. [20 August 2024]. Available from: https://www.infoteca.cnptia.embrapa.br/bitstream/doc/541436/1/cir063.pdf
- Souza G.M., Barbosa A.M. 2015. Fatores de estresse no milho são diversos e exigem monitoramento constante. Visão agrícola, 13: 30-34.
- Streit N.M., Canterle L.P., Canto M.W.D., Hecktheuer, L.H.H. 2005. As clorofilas. Ciência Rural, 35: 748-755. https://doi.org/10.1590/S0103-84782005000300043
- Sweet N.L. 2007. Chardonnay history and selections at FPS. Foundation Plant Services: FPS grape Program Newsletter. [Internet]. [24 july 2024]. Available from: https://iv.ucdavis.edu/files/24489.pdf
- Tanaka R., Tanaka A. 2011. Chlorophyll cycle regulates the construction and destruction of the light-harvesting complexes. Biochimica et Biophysica Acta (BBA)-Bioenergetics, 1807: 968-976. https://doi.org/10.1016/j.bbabio.2011.01.002
- Tarouco A.S., Lopes A.R., Coutinho A.E., Oliveira V.G., Borghi S.B., Del Aguila J.S. Fertilizante foliar na ′Chardonnay′em Dom Pedrito-Rio Grande do Sul (RS). [Internet]. [24 july 2024]. Available from: https://unipampa.edu.br/portal/sites/default/files/20-191-tarouco.pdf
- Teixeira G., Monteiro A., Santos C., Lopes C.M. 2018. Leaf morphoanatomy traits in white grapevine cultivars with distinct geographical origin. Ciência e Técnica Vitivinícola, 33: 90-101. https://doi.org/10.1051/ctv/20183301090
- Tomczyk A., Kropczynska D. 1985. Effects on the host plant. In: Helle W., Sabelis M.W. (Eds.). Spider Mites, Their Biology, Natural Enemies and Control. Amsterdam: Elsevier. pp. 312.
- Vijayaraghavareddy P., Adhinarayanreddy V., Vemanna R.S., Sreeman S., Makarla, U. 2017. Quantification of membrane damage/cell death using Evan's blue staining technique. Bio-protocol, 7: 1-8. https://doi.org/10.21769/BioProtoc.2519
- Zart M., Cesaro A.D., Santos H.P.D., Souza P.V.D.D. 2014. Caracterização morfo-fisiológica de plantas de videira atacadas por pérola-da-terra. Semina: ciências agrárias, 35: 1187-1200. https://doi.org/10.5433/1679-0359.2014v35n3p1187
- Walter D. E., Proctor H. C. 1999. Mites: ecology, evolution and behaviour. Sydney: Springer. pp. 505. https://doi.org/10.1079/9780851993751.0000
- McCoy K.D. 2025. Birds ticks. In: Kreiter S., McCoy K.D. (Eds). Birds of the world. Montpellier: Publisher. p. 600-700.
- Willmer C., Fricker M. 1996. The distribution of stomata. In: Willmer C., Fricker M. (Eds) Stomata. Springer. pp. 12-35. https://doi.org/10.1007/978-94-011-0579-8_2
- Wurz D.A. 2018. Análise da comercialização de vinhos finos e de mesa no Brasil. Journal of Agronomical Science, 7: 43-49.


2024-11-14
Date accepted:
2025-07-26
Date published:
2025-08-11
Edited by:
Tsolakis, Haralabos

This work is licensed under a Creative Commons Attribution 4.0 International License
2025 Pavan, Aline Marjana; Da-Costa, Tairis; Picoli Ribeiro, Luiza and Juarez Ferla, Noeli
 Download article
Download the citation
RIS with abstract
(Zotero, Endnote, Reference Manager, ProCite, RefWorks, Mendeley)
RIS without abstract
BIB
(Zotero, BibTeX)
TXT
(PubMed, Txt)