


Functional response of abamectin and bifenazate resistant and native populations of Amblyseius swirskii Athias-Henriot (Acari: Phytoseiidae)
Doğan, Ceren  1
and Kumral, Nabi Alper
2
1
and Kumral, Nabi Alper
2
1Department of Plant Protection, Faculty of Agriculture, Uludag University, Gorukle Campus, Bursa, 16059, Turkey.
2✉ Department of Plant Protection, Faculty of Agriculture, Uludag University, Gorukle Campus, Bursa, 16059, Turkey.
2025 - Volume: 65 Issue: 3 pages: 721-735
https://doi.org/10.24349/8xdi-ye1mOriginal research
Keywords
Abstract
Introduction
Predatory mites are key biocontrol agents of various phytophagous mites and some other agricultural pests, playing a crucial role in suppressing their populations (Helle and Sabelis 1985; McMurtry and Croft 1997). Among target preys, spider mites (Acari: Tetranychidae) are highly destructive and widely distributed pests affecting numerous crops and ornamental plants. The development of resistance to acaricides in these pests has necessitated extensive research into alternative control methods. Recent studies on the biological control of tetranychid mites have primarily focused on the Phytoseiidae family due to their efficacy in maintaining prey populations at low densities (Song et al. 2016; Park et al. 2021). The predatory mite Amblyseius swirskii Athias-Henriot (Acari: Phytoseiidae) is a highly effective biocontrol agent widely used for managing whiteflies, thrips, and spider mites in both open-field and greenhouse crops (McMurtry et al. 2013; Calvo et al. 2015; Knapp et al. 2018). Its relatively low-cost mass production has contributed to its widespread adoption as a biocontrol agent. Beyond its ability to prey on a diverse range of pests, A. swirskii is a highly adaptable Type III generalist predator that can utilize non-prey resources such as pollen, allowing it to survive during periods of prey scarcity (McMurtry et al. 2013). Commercial populations of A. swirskii have been successfully integrated into integrated pest management (IPM) programs for controlling these pests (Calvo et al. 2012; Demirtaş et al. 2022; Kolcu and Kumral 2023).
Despite the significant potential of A. swirskii in controlling spider mites, whiteflies, and thrips, its predator-prey interactions remain insufficiently understood. While A. swirskii preys on spider mites, exclusive reliance on them may not be sufficient to keep their populations below the economic injury threshold in the long term (Mortazavi et al. 2019; Aly 2023). Although A. swirskii can prey on spider mites, its feeding preference is primarily directed towards whiteflies and thrips (Lopez 2023), which may reduce its effectiveness in suppressing T. urticae populations under certain conditions (Soleymani et al. 2016a,b; Yari et al. 2023). However, commonly used acaricides such as bifenazate and abamectin have been reported to exhibit high toxicity to A. swirskii when applied at recommended field concentrations (Fiedler and Sosnowska 2012; Döker and Kazak 2019; Kolcu and Kumral 2023). Bifenazate, a carbazate-based insecticide-acaricide, is among the most widely used pesticides worldwide for managing phytophagous mites. It primarily targets mitochondrial sites and exhibits non-systemic characteristics with contact and residual activity (van Nieuwenhuyse 2012; PPDB 2024). Abamectin, an avermectin-class insecticide-acaricide, is a natural fermentation product of Streptomyces avermitilis and exhibits high acute toxicity against numerous arthropod pests (PPDB 2024). Due to their mode of action, these pesticides do not exhibit specificity toward phytoseiids. Therefore, using an A. swirskii population resistant to these two acaricides could be a rational approach in IPM programs. In addition to the acute toxic effects of the recommended application doses, understanding their sublethal effects is crucial for assessing the predator's effectiveness (Havasi et al. 2021; Mousavi et al. 2022; Mousavi et al. 2023; Kolcu and Kumral 2023). Therefore, it is essential to thoroughly investigate the impact of these acaricides on the predatory mite's predator capacity.
Examining the functional response characteristics of natural enemies is a fundamental approach for assessing their efficiency in regulating pest populations (Fantinou et al. 2012). The type of functional response and its parameters can be influenced by various factors, including prey species, prey developmental stage, predator age, host plant characteristics, temperature, and humidity (Escudero and Ferragut 2005; Ahn et al. 2010; Farazmand et al. 2012; Döker et al. 2016; Song et al. 2016; Fathipour et al. 2017a,b). Recently, there has been increasing interest in understanding the functional response of A. swirskii to Tetranychus urticae Koch (Acari: Tetranychidae) (Xiao et al. 2013; Fathipour et al. 2017b; Fathipour et al. 2020). A previous study, showed that the life table parameters of resistant populations (RP) of A. swirskii were not significantly affected by the development of resistance (Doğan and Kumral 2025). Nevertheless, the effect of resistance on the functional response of this resistant strain remains unexplored. Additionally, previous functional response studies, which typically lasted only two days, may not fully capture the long-term effects of predation (Bazgir et al. 2020). Therefore, a distinctive aspect of the present study is the continuous assessment of predation capacity from the larval stage until adult mortality.
A crucial step in evaluating the potential of A. swirskii to control T. urticae egg populations under both control and treatment conditions (NP and RP groups) is to analyze its functional response and consumption rate under varying prey densities. The aim of this study was to evaluate the potential impact of abamectin+bifenazate resistance on the functional and numerical responses of A. swirskii by comparing untreated individuals with those exposed to the recommended concentration of the acaricide. Specifically, the objectives were (i) to determine the functional response type and key parameters (attack rate and handling time), and (ii) to assess the effects on prey consumption and oviposition.
Materials and methods
Mite rearing
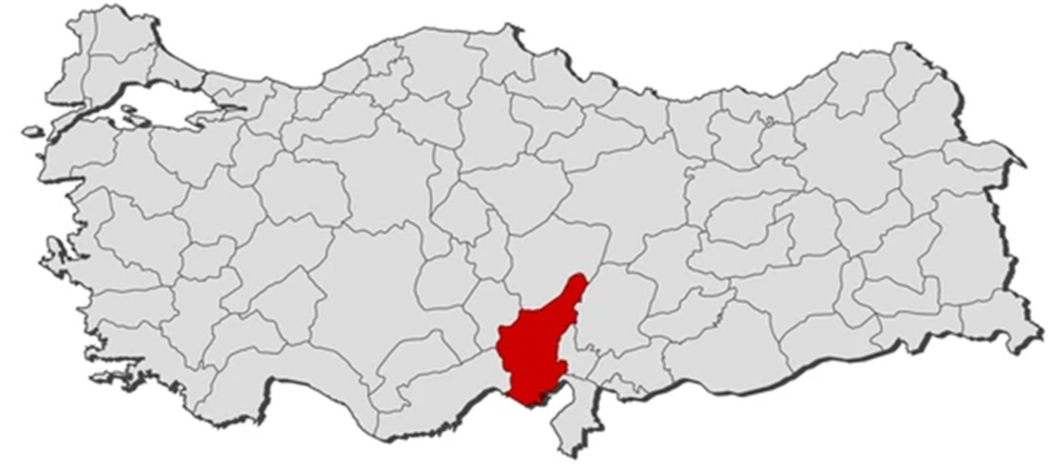
The native population (NP) of A. swirskii was initially collected in 2020 from an orange orchard located in the Kozan district of Adana province, Türkiye (Figure 1). This population was previously identified by Mertoğlu Boz et al. (2024) through both molecular and morphological identifications. The continuous mass rearing of this NP has been maintained under pesticide-free conditions in the Acarology and Toxicology Laboratory at Bursa Uludağ University. The abamectin- and bifenazate-resistant population (RP) was developed from six successive selections of this NP in a prior study conducted by Doğan and Kumral (2025).
To sustain the nutrition of these populations, all developmental stages of Carpoglyphus lactis (L.) (Acari: Carpoglyphidae) and cattail pollen (Typha latifolia L.) were provided. Additionally, the green-form population of Tetranychus urticae Koch (Acari: Tetranychidae), which was used in all predatory capacity experiments, was maintained on the leaves of pepper plants (Capsicum annuum L., Burkalem cv., Bursa Tohum, Türkiye) under controlled conditions. All rearing procedures were conducted in regulated growth chambers set at 28 ± 1 °C, with a relative humidity of 80 ± 5%, and a photoperiod of 16:8 h (light: dark cycle).
Chemicals
Saury, a commercially available acaricide (Sumi Agro, Türkiye), formulated with 125 g/L bifenazate and 7.5 g/L abamectin as active ingredients, was utilized in biological assessments. This acaricide was specifically selected due to its approved registration for various vegetable crops. This, makes it a suitable option for the potential integration of A. swirskii in the biological control of mites, whiteflies, and thrips.
Acaricide treatments
The side effects of the recommended concentration (100 ml/100 L distilled water) of this acaricide formulation were previously evaluated for both the NP and RP of A. swirskii in our earlier study (Doğan and Kumral 2025). Based on acute toxicity results, the concentration was classified as moderately harmful (80–99%) for NP and harmless (>30%) for RP. According to the residual bioassay method, 2 mL of the recommended concentration was applied to the undersides of pepper leaves using a Potter Spray Tower (Burkard Scientific, Uxbridge, UK) (Overmeer and Van Zon 1982; Kumral et al. 2021). Briefly, the spraying process, conducted for three seconds, resulted in a deposition of 1.5 mg of liquid per cm². The treated pepper leaves were then left to air-dry for 30 minutes at room temperature. As a control, leaves were sprayed with distilled water (Potter 1952). Plexiglas Munger cells (8 × 10 × 1 cm) with a central circular opening of 5 cm in diameter were used for the bioassay setup. The treated leaf, along with a filter paper, was placed between two Plexiglas plates-one featuring the circular opening and the other solid. The filter paper was lightly moistened with distilled water to maintain adequate moisture levels.
Functional and numerical response experiments
The treatments were administered at the suggested concentration under controlled environmental conditions, with a temperature of 28 ± 1 °C, a photoperiod of 16:8 hours (L:D), and a relative humidity of 80 ± 5%. Functional and numerical responses on both pesticide-treated and untreated (control) pepper leaves were evaluated through two-day experiments. The methodology for functional response assessment was adapted from Hull et al. (1977). Briefly, pesticide-treated or untreated (control) pepper leaves, as previously described, were placed in Munger cells and used as experimental arenas. To examine the functional and numerical responses of the predator in both populations (NP and R6), experiments were conducted using 15 A. swirskii females, aged 3–4 days, during their oviposition period. Before each experiment, the females were subjected to a 24-hour starvation period. On the following day, T. urticae eggs at varying densities (5, 10, 20, 40, and 80 eggs) were provided as prey, as this period was chosen to avoid any effects from the tested acaricides while ensuring a consistent prey supply (Chow et al., 2010; Göksel and Kumral, 2022). Only eggs were selected as prey since the applied acaricides do not have ovicidal effects. The prey eggs were gently transferred onto leaf discs with a fine paintbrush (No. 0000). After 24 hours, the number of prey eggs consumed by each predator was recorded, and after 48 hours, the number of eggs laid was documented. No additional prey was provided during the second 24-hour period, and the predators remained undisturbed in the same experimental arenas throughout the 48-hour duration.
Prey consumption during development and adult life span
The prey consumption of A. swirskii populations, including both the native (NP) and resistant (RP) strains, was evaluated across their developmental stages and adult life span under both untreated (control) and acaricide-treated conditions. The acaricide treatment consisted of a formulation containing a combination of abamectin and bifenazate, applied to bean leaves at the recommended field concentration. Biological observations were conducted using Munger cells, as previously described (Demard & Qureshi, 2023). Briefly, one newly emerged female and two males of A. swirskii were introduced into each Munger cell to allow for mating and oviposition. After 24 hours, all adults and surplus eggs were removed, ensuring that only a single egg remained on each leaf disc within the Munger cell. To provide a consistent prey supply, 50 T. urticae eggs were added weekly to each Munger cell as food for the predatory mites. Prey consumption was assessed by recording the number of T. urticae eggs consumed every 24 hours, starting from the larval stage and continuing until the death of both the male and female predatory mites. Each treatment was replicated 40 times. To maintain optimal environmental conditions, the phytoseiid mites were transferred from older leaves to freshly treated or untreated leaves at seven-day intervals. In the acaricide-treated groups, the leaves were sprayed immediately prior to transferring the mites.
Data analysis
The functional response data were analyzed in two stages, following the approach of Holling (1959). Initially, logistic regression was employed to assess the relationship between the proportion of prey consumed and the initial prey density, allowing for the identification of the functional response curve shape for NP and RP of A. swirskii across different densities of T. urticae eggs.
\[N_e / N_0=\frac{\exp \left(P_0+P_1 N_0+P_2 N_0^2+P_3 N_0^3\right)}{1+\exp \left(\left(P_0+P_1 N_0+P_2 N_0^2+P_3 N_0^3\right)\right.} (3.1)\]
In this context, Ne represents the number of prey consumed, N0 denotes the initial prey density, and (Ne/N0) indicates the probability of prey consumption. The parameters P0, P1, P2, and P3 correspond to the intercept, as well as the linear, quadratic, and cubic coefficients, respectively, which were estimated using the maximum likelihood method. The type of functional response was determined based on the signs of P1 and P2. If the linear coefficient was negative (P1 < 0), the functional response was classified as Type II, as the proportion of prey consumed declined monotonically with increasing initial prey density (Jualino et al. 2001). In the next step, the handling time (Th) and attack rate (α) coefficients for a Type II functional response were analyzed using Rogers' random predator equation (Rogers 1972: Formula 3.2).
\[N_{h a}=N\left[1-\exp \left\{-\alpha^{\prime}\left(T-T_h N_{h a}\right)\right\}\right] (3.2)\]
If the functional response was classified as Type III, these parameters were calculated using the equation (Formula 3.3) proposed by Hassell et al. (1977).
\[N_{h a}=N\left(N-N_{h a}\right)\left[c \log \left\{\frac{N-N_{h a} }{N}\right\}-b T_h N_{h a}+b T\right] (3.3)\]
In the formulas, N represents the initial prey density, Nha denotes the number of prey consumed by the predator, α′ refers to the search rate, T indicates the duration of the trial within a specific trial area (days), Th corresponds to the prey capture and feeding time (days), and b and c are the regression coefficients. Nonlinear regression was employed to estimate the attack rate and handling time parameters (Proc NLIN, SAS Institute). To evaluate the effects of prey density, population type (natural vs. resistant treated or untreated with the acaricide), and their interaction on prey consumption, we used a generalized linear model (GLM) with a binomial error distribution and a logit link function. The effects of acaricides on biological parameters of mites were statistically analyzed using one-way ANOVA with a significance level of P < 0.01 after checking for normality. Means were compared with the Tukey test accepting significant differences at P < 0.01. SPSS software version 23 was used for mean comparisons.
Results
Functional response
Download as a Acaricide-untreated natural population b Natural population treated with the recommended concentration of bifenazate and abamectin c Acaricide-untreated resistant population d Resistant population treated with the recommended concentration of bifenazate and abamectin
Populations/Treatments
Parameters
Estimate ± SE
χ2
P-value
Functional response
NP Untreateda
Intercept (P0)
0.7176± 0.0962
7.46
<0.01
TYPE II (P1<0) and Probability value is significant
Linear (P1)
-0.0133±0.0059
-2.25
0.026
Quadratic (P2)
-0.0003±0.0004
-0.65
0.519
Cubic (P3)
0.0000006±0.000001
0.71
0.476
NP Acaricide treatedb
Intercept (P0)
0.5985±0.1149
5.21
<0.01
TYPE III (P1>0) and (P2<0)
Linear (P1)
0.00085±0.0064
0.13
0.895
Quadratic (P2)
-0.000596± 0.0005
-1.15
0.254
Cubic (P3)
0.0000006±0.000013
0.47
0.638
RP Untreatedc
Intercept (P0)
0.6073±0.07361
8.25
<0.01
TYPE II (P1<0) and Probability value is significant
Linear (P1)
-0.0132±0.0039
-3.39
<0.01
Quadratic (P2)
0.00063±0.0004
1.82
0.71
Cubic (P3)
-0.000011± 0.0000007
-1.6
<0.01
RP Acaricide treatedd
Intercept (P0)
0.5600±0.0725
7.72
<0.01
TYPE II (P1<0) and Probability value is significant
Linear (P1)
-0.0152±0.0037
-4.15
<0.01
Quadratic (P2)
0.001072±0.0003
3.32
0.07
Cubic (P3)
-0.000002± 0.0000007
1.05
0.11
The results of the logistic regression analysis indicated a significantly negative linear coefficient (P1 < 0) for all untreated NP populations, as well as for both treated and untreated RP populations, suggesting that the proportion of prey consumed decreased when prey density reached high levels. However, the treated NP population displayed a positive linear (P1 > 0) and negative quadratic coefficient (P2 < 1) across all prey intensities, indicating that individuals in this population were not present at low prey intensities. Consequently, while the untreated NP population, as well as the treated and untreated RP populations of A. swirskii, followed a Type II functional response across all prey intensities, the treated NP population exhibited a Type III functional response under the same conditions (Table 1).
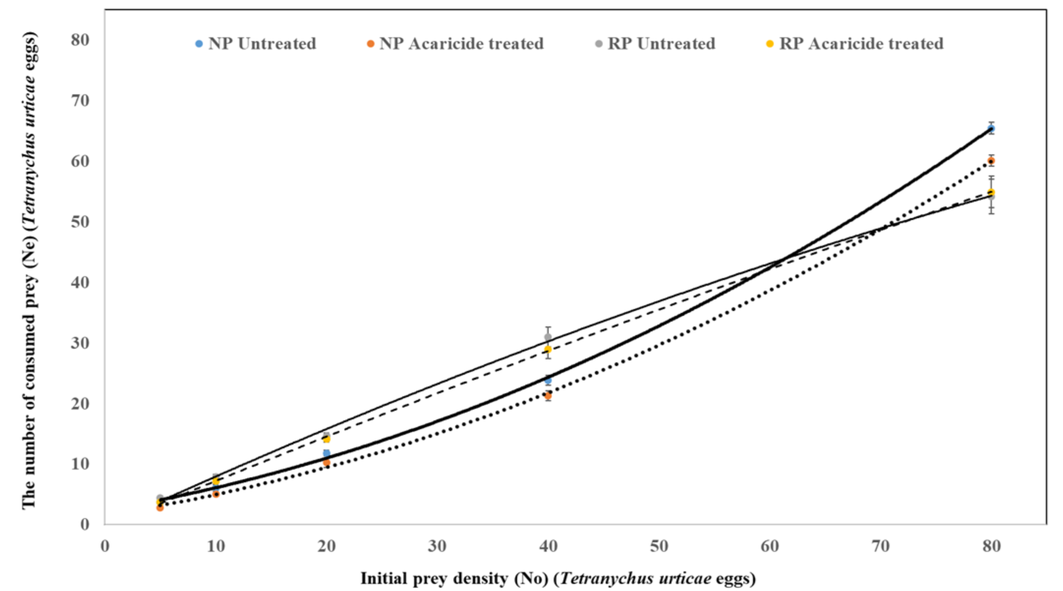
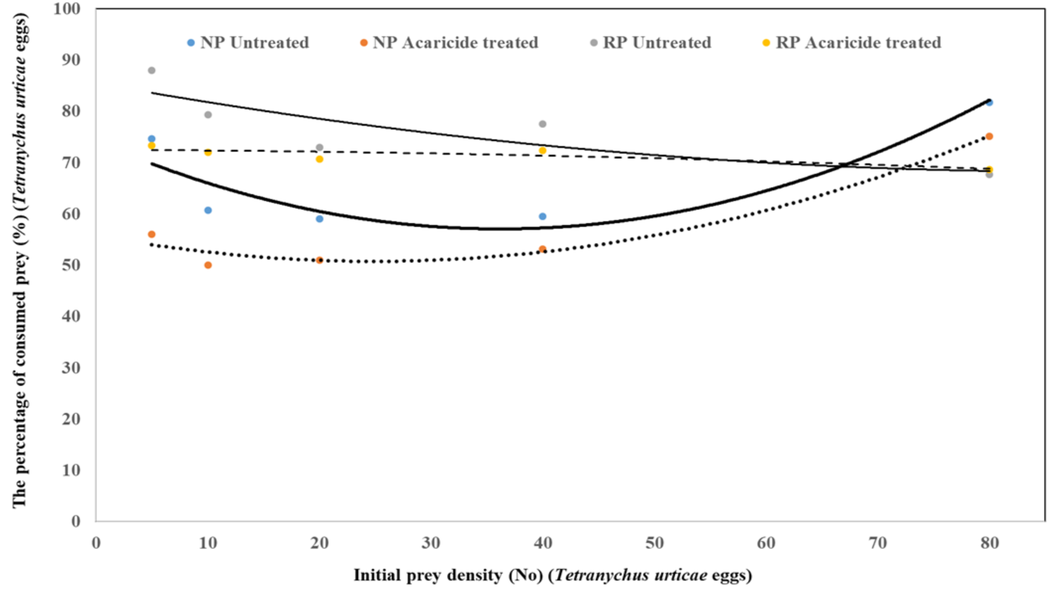
The interaction between predator populations and prey density had a significant effect on the number of prey consumed (population F = 16.49, P < 0.01; prey comsuption F = 951.72, P < 0.01; population x prey comsuption F = 951.72, P < 0.01). At prey densities ranging from 5 to 40 eggs, the highest consumption was observed in the untreated RP population, whereas the lowest consumption rate was recorded in the treated NP population (Table 2, Figure 2 and 3). In these prey density ranges, the highest consumption occurred in the untreated RP population, followed by the RP population treated with the recommended concentration. These differences in prey consumption were statistically significant. At a prey density of 80 eggs, no significant differences were observed between the consumption rates of the treated NP population and those of the untreated and treated RP populations. The consumption rate of both treated and untreated RP populations, as well as the untreated NP population, gradually increased as prey density increased. However, in the treated NP population, prey consumption was either significantly lower or absent at low prey densities, suggesting a reduced ability to locate prey under these conditions. The untreated NP population consumed between 60% and 88% of T. urticae eggs, whereas the treated NP population consumed only 50% to 75% of the eggs across all prey densities (5, 10, 20, 40, and 80). The consumption rates of treated and untreated RP populations were similar, ranging from 67% to 79% of T. urticae eggs. The proportion of prey consumed by A. swirskii females in both NP and RP populations decreased as prey density increased (Table 2, Figure 2 and 3).
Download as a Acaricide-untreated natural population b Natural population treated with the recommended concentration of bifenazate and abamectin c Acaricide-untreated resistant population d Resistant population treated with the recommended concentration of bifenazate and abamectin * In the ANOVA analysis, for treatments where significant differences were detected, different letters in the same column indicate statistically significant differences between means at the 1% significance level according to the Tukey test.
Prey density
Populations / Treatments
Number of prey consumed (Ne) (Mean ± SE)
Ne/No** (Mean ± SE)
Df. F. P
5
NP Untreateda
3.73±0.30a*
74.67±6.01
3,59; 5.01; <0.01
NP Acaricide treatedb
2.80±0.26ab
56.00±5.24
RP Untreatedc
4.40±0.29ab
88.00±5.80
RP Acaricide treatedd
3.66±0.32b
73.33±6.38
10
NP Untreateda
6.07±0.47bc
60.67±4.73
3,59; 11.03; <.001
NP Acaricide treatedb
5.00±0.28c
50.00±2.76
RP Untreatedc
9.93±0.38a
79.33±3.84
RP Acaricide treatedd
7.20±0.39ab
72.00±3.84
20
NP Untreateda
11.80±0.46b
59.00±2.29
3,59; 12.99; <0.01
NP Acaricide treatedb
10.20±0.73b
51.00±3.63
RP Untreatedc
14.60±0.57a
73.00±2.84
RP Acaricide treatedd
14.13±0.49a
70.67±2.48
40
NP Untreateda
23.80±0.79b
59.50±1.99
3,59; 12.81; <0.01
NP Acaricide treatedb
21.27±0.81b
53.16±2.02
RP Untreatedc
31.00±1.62a
77.50±4.05
RP Acaricide treatedd
28.93±1.55a
72.33±3.86
80
NP Untreateda
65.40±1.00a
81.75±1.25
3,59; 6.58; <0.01
NP Acaricide treatedb
60.07±0.90ab
75.10±1.12
RP Untreatedc
54.13±2.84b
67.66±3.54
RP Acaricide treatedd
54.87±2.61b
68.58±3.26
The treated and untreated RP populations exhibited a higher attack rate coefficient (α) compared to the treated and untreated NP populations across all prey densities. The highest attack rate (α) was observed in the untreated RP population (1.27 ± 0.18), followed by the treated RP population (1.13 ± 0.21), the untreated NP population (1.00 ± 0.14), and the treated NP population (0.71 ± 0.08). However, the differences between populations and treatments were not statistically significant. While A. swirskii individuals from the RP population exhibited a higher attack rate on prey than those from the NP population, this difference was not statistically significant (P = 0.17). The handling time (Tₕ) of RP populations was significantly shorter across all prey densities compared to NP populations. The shortest handling time (Tₕ) among all populations was observed in the untreated RP population (0.0376 ± 0.0019), followed by the treated RP population (0.0381 ± 0.0018), the treated NP population (0.0420 ± 0.0007), and the untreated NP population (0.0454 ± 0.0007) (Table 3). The prey handling time of the predatory mite varied significantly across treatments (P < 0.01). The longest prey handling time was observed in the NP population treated with acaricide, whereas the shortest was recorded in the treated RP population. However, no significant differences were found in the prey handling time between the treated and untreated RP populations or between the untreated NP population and the treated RP population, regardless of acaricide treatment.
Download as a Acaricide-untreated natural population b Natural population treated with the recommended concentration of bifenazate and abamectin c Acaricide-untreated resistant population d Resistant population treated with the recommended concentration of bifenazate and abamectin The values α, attack rate; Th, handling time * In the ANOVA analysis, for treatments where significant differences were detected, different letters in the same column indicate statistically significant differences between means at the 1% significance level according to the Tukey test
Populations/Treatments
α (h-1)
Th (h)
NP Untreated
1.00±0.14a*
0.0454±0.0007ab
NP Acaricide treated
0.71±0.08a
0.0420±0.0007a
RP Untreated
1.27±0.18a
0.0376±0.0019b
RP Acaricide treated
1.13±0.21a
0.0381±0.0018b
Df. F. P
3,11; 2.19; 0.17
3,59; 6.61; <0.01
Prey consumption during longevity of females and males
The variations in prey consumption by A. swirskii females across all biological stages were statistically significant among different treatments and populations (Table 4). The lowest consumption levels were observed in the treated NP population during the deutonymph and adult stages, followed by the untreated NP population. No significant differences in prey consumption were observed between the untreated and treated RP populations, except during the deutonymph stage.
Download as a Acaricide-untreated natural population b Natural population treated with the recommended concentration of bifenazate and abamectin c Acaricide-untreated resistant population d Resistant population treated with the recommended concentration of bifenazate and abamectin * In the ANOVA analysis, for treatments where significant differences were detected, different letters in the same column indicate statistically significant differences between means at the 1% significance level according to the Tukey test
Populations / Treatments
Larvae
Protonymph
Deutonymph
Adult (female)
NP Untreateda
2.72±0.30a*
9.20±0.45a
29.61±0.75c
121.48±1.35b
NP Acaricide treatedb
2.67±0.24a
6.74±0.40b
16.71±0.65d
17.29±0.83c
RP Untreatedc
2.95±0.28a
6.73±0.28b
36.82±0.65a
133.50±2.44a
RP Acaricide treatedd
3.05±0.26a
6.86±0.37b
32.81±0.55b
131.52±1.75a
Df. F. P
3,111; 0.39; 0.76
3,101; 5.95; <0.01
3,95; 112.81; <0.01
3,90; 840.09; <0.01
Similarly, the differences in prey consumption by A. swirskii males across all biological stages were also significant among different treatments and populations (Table 5). In particular, the lowest T. urticae egg consumption was recorded in the treated NP population during the deutonymph and adult stages. However, no significant differences were observed in prey consumption among the untreated NP population and the treated and untreated RP populations.
Download as a Acaricide-untreated natural population b Natural population treated with the recommended concentration of bifenazate and abamectin c Acaricide-untreated resistant population d Resistant population treated with the recommended concentration of bifenazate and abamectin * In the ANOVA analysis, for treatments where significant differences were detected, different letters in the same column indicate statistically significant differences between means at the 1% significance level according to the Tukey test.
Populations / Treatmetns
Larvae
Protonymph
Deutonymph
Adult (male)
NP Untreateda
1.67±0.42b*
11.50±0.76a
31.00±.1.59a
89.50±0.65a
NP Acaricide treatedb
2.50±0.65b
7.50±1.71b
14.75±1.93b
16.25±1.03b
RP Untreatedc
4.20±0.36a
7.10±0.43b
35.50±0.65a
79.20±1.95a
RP Acaricide treatedd
2.50±0.27b
7.20±0.33b
35.90±1.59a
78.50±11.66a
Df. F. P
3,29; 8.62; <0.01
3,29; 9.75; <0.01
3,29; 32.84; <0.01
3,29; 9.27; <0.01
Numerical response
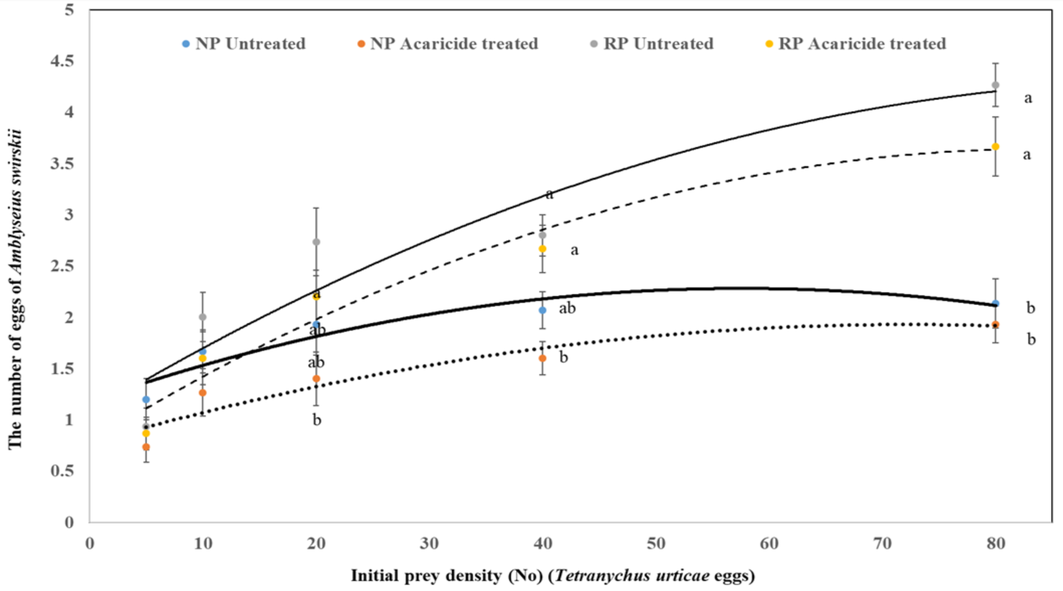
When examining egg-laying performance, the lowest number of eggs was observed in the NP population treated with acaricide (1.93 ± 0.18) at the highest prey density (80 prey), followed by the untreated NP population (2.13 ± 0.24), the treated RP population (3.67 ± 0.29), and the untreated RP population (4.27 ± 0.21), respectively. Similar significant differences were observed at prey densities of 20 and 40 (P = 0.02 and P < 0.01, respectively). At the lowest prey densities (5 and 10), the differences among populations and treatments were insignificant (P = 0.30 and P = 0.18, respectively). The divergence between the curves became more pronounced after a prey density of 20, with treated and untreated RP populations exhibiting the highest egg-laying rates (Figure 4).
Discussion
Functional response is a commonly used tool for understanding the interaction between prey and predators (Kasap and Atlihan 2011). However, determining the functional response type of a predator in combination with a pesticide is a valuable approach for evaluating the toxicity of these compounds (Shen et al. 2017). In the present study, both resistant and native populations of A. swirskii exhibited a type II functional response when preying on T. urticae eggs. The type II functional response model is characterized by a decelerating predation curve that reaches a plateau as prey density increases, acting as a destabilizing factor in predator-prey dynamics (Hassell et al. 1977). Previous studies have demonstrated that A. swirskii exhibits a type II functional response when feeding on different biological stages of spider mites (Fathipour et al. 2020; Shirvani et al. 2023; Elmoghazy et al. 2024). Similarly, a study of using as prey Bemisia tabaci (Genn.) (Hemiptera: Aleyrodidae) reported that A. swirskii also exhibited a type II functional response (Golshan et al. 2023). The type II functional response is commonly seen in several phytoseiid species, including Chileseius camposi (González & Schuster) (Sepúlveda and Carrillo 2008), Phytoseius plumifer (Canestrini and Fanzago) (Kouhjani Gorji et al. 2009), Phytoseiulus persimilis (Athias-Henriot) (Seiedy et al. 2012), Neoseiulus barkeri (Hughes), Euseius nicholsi (Ehara & Lee) (Yao et al. 2014), Neoseiulus cucumeris (Oudemans), Neoseiulus californicus (McGregor), Neoseiulus longispinosus (Evans) (Song et al. 2016), Neoseiulus bicaudus (Wainstein) (Zhang et al. 2017), and Euseius concordis (Chant) (da Silveira et al. 2020). At higher prey densities, the proportion of prey consumed decreased, likely due to predator satiation or interference, both of which reduce predation efficiency (Holling 1959; Park et al. 2011; Carrillo and Pena 2012; Bazgir et al. 2018). The results indicated that feeding increased linearly at low to medium prey densities but plateaued upon reaching maximum satiation. These findings suggest that the predatory efficiency of this species is enhanced when T. urticae egg densities are from low to moderate. Similar results have been reported by Xiao et al. (2013) and Farazmand and Amir-Maafi (2021).
The functional responses of predators can shift from one type to another depending on environmental conditions or pesticide treatments (Mohaghegh et al. 2001; Li et al. 2006; Afshar and Latifi 2017; Afza et al. 2021). In the present study, exposure to the recommended concentration of the acaricide (abamectin and bifenazate mixture) changed the functional response of the native A. swirskii population from type II to type III. In contrast, when exposed to the same acaricide, the resistant population maintained a type II functional response. Similarly, Afza et al. (2021) found comparable results, reporting that the functional response of Coccinella septempunctata L. (Coleoptera: Coccinellidae) shifted from type II to type III following the application of imidacloprid, profenophos, and chlorpyrifos with sublethal concentrations. Similarly, a shift from type II to type III in the functional response of Scolothrips takahashii Priesner (Thysanoptera: Thripidae) was reported in the sublethal concentration of abamectin exposure (Li et al. 2006). Moreover, Gu (1991) showed that the functional response of Diaeretiella rapae M′Intosh (Hymenoptera: Aphidiidae) changed from type II to type III after exposure to cypermethrin, dimethoate and pirimicarb. In contrast to our findings, sublethal concentrations of bifenazate did not affect on the functional response of different biological stages of N. bicaudus preying on Tetranychus turkestani Ugarov & Nikolski (Acari: Tetranychidae) (Shen et al. 2017). In the current study, this shift in functional response may be attributed to unconsciousness and disorientation induced by abamectin, which targets the insect nervous system (Li et al. 2006). On the other hand, our findings indicate that the type of functional response of the A. swirskii population, which developed resistance to both abamectin and bifenazate, remained Type II after exposure to the recommended concentration of the acaricide.
The attack rate and handling time are two key parameters used to assess the magnitude of functional responses (Pervez and Omkar 2006). Handling time is a key indicator of consumption rate and predator efficiency. It represents the total time required for capturing, killing, and digesting prey (Veeravel and Baskaran 1997a,b). It can be influenced by predator speed, prey movement, and the time required to subdue prey, which may relate to behavioral and structural defense mechanisms (Hassell 1978; Ali et al. 2011). At varying densities of T. urticae eggs, the mean attack rate (α) and handling time (Th) of adult female A. swirskii were measured. In the native population, α and Th were 1.00 and 0.0454, respectively, while in the resistant population, they were 1.27 and 0.0376. Fathipour et al. (2017b) reported a handling time of 1.387 for A. swirskii, with its functional response identified as both type II and type III. Afshar and Latifi (2017) observed a type III response at 25 °C, and type II at 30 and 35 °C; handling time ranged from 0.46 to 0.6, while the attack rate (α) was 0.56. Golshan et al. (2023) estimated α and Th as 0.106 and 0.353, respectively, when A. swirskii fed on different developmental stages of B. tabaci, and reported a type II functional response. The results are largely consistent with previous studies, with observed differences likely attributed to variations in experimental temperatures, absence of pesticide application, and the use of different host plants or prey species. In the present study, following acaricide application, these values were 0.71 and 1.13 for α, and 0.0420 and 0.0381 for Th in native and resistant populations of A. swirskii, respectively. Although the attack rate in the native population did not differ significantly, a slight decrease was observed. However, handling time was significantly prolonged compared to the untreated native population, indicating a potential impact on predation efficiency. In contrast, neither of the key parameters was affected in the resistant population after exposure to the acaricide. Similar adverse effects have been reported following exposure to sublethal concentrations of certain pesticides. These effects include reduced attack rates and prolonged handling times in several predator species (Wang and Shen 2002; Claver et al. 2003; Li et al. 2006).
One of the significant limitations of functional response studies is that they are typically conducted over a short period, often lasting only two days, which does not represent the predator's entire lifespan. Therefore, in this study, the prey consumption of A. swirskii was monitored from the larval stage until the death of the adult. This approach allowed for a more comprehensive assessment of the effects of the acaricide on prey consumption over an extended period. In the present study, the number of prey consumed (number of eggs) by female A. swirskii that were not treated with the acaricide was very similar in both the natural and resistant populations. Following acaricide application, prey consumption significantly decreased in the native population compared to the untreated conditions. Similar to other biological parameters, prey consumption in the resistant population slightly increased compared to the natural population, and no reduction was observed in the resistant population after acaricide exposure.
Momen and Elsaway (1993) reported that female predators consumed 15 to 125 T. urticae individuals per day. Yan-Xuan and Jian-Zhen (2011) documented a daily prey consumption rate of 57.6 eggs per female. Maroufpoor (2017) recorded average predation rates on eriophyid and spider mites as 183 and 420 individuals per day, respectively. Golshan et al. (2023) observed that female mites laid an average of 67.91 eggs per day. These findings are largely consistent with our results. In general, the consumption rate of a predator decreases as the size of the prey's life stage increases (Ali et al. 2011; Fathipour et al. 2017b; Bazgir et al. 2018). Amblyseius swirskii consumed T. urticae eggs at a higher rate compared to other developmental stages (Soleymani et al. 2016a,b).
Conclusion
In conclusion, the abamectin and bifenazate mixture acaricide is relatively safe for the resistant population of A. swirskii. This finding suggests that resistance mechanisms are crucial in maintaining functional response stability. These findings provide valuable insights into the ecological impact of acaricides on predatory mites. Although laboratory-based functional response studies offer valuable insights into predator-prey interactions and arthropod population dynamics, they have limitations when applied to natural conditions. Factors such as artificially high prey densities, absence of natural barriers like webbing, and lack of multispecies interactions can magnify predation efficiency. The compatibility of the resistant population with acaricide-treated environments highlights their potential for use in IPM programs (Liang et al. 2015; Bielza 2016; Tabashnik et al. 2018). The use of resistant A. swirskii appears compatible with biological control and IPM programs. Therefore, while the findings support future studies and management strategies for T. urticae, field-based research is essential to accurately assess the biocontrol potential under realistic environmental conditions.
Acknowledgements
The authors gratefully acknowledge financial support from the Scientific and Technological Research Council of Turkey (TÜBİTAK) under project number 122R115, also to Gamze MERTOĞLU BOZ for her assistance in collecting the phytoseiids.
References
- Afshar, F. R., Latifi, M. 2017. Functional response and predation rate of Amblyseius swirskii (Acari: Phytoseiidae) at three constant temperatures. Persian Journal of Acarology, 6(4), 299-314. https://doi.org/10.22073/pja.v6i4.32392
- Afza R., Riaz M.A., Afzal M., Majeed, M.Z. 2021. Adverse effect of sublethal concentrations of insecticides on the biological parameters and functional response of predatory beetle Coccinella septempunctata (Coleoptera: Coccinellidae) of brassica aphid. Sarhad Journal of Agriculture,37(1):226-234. https://doi.org/10.17582/journal.sja/2021/37.1.226.234
- Ahn, J. J., Kim, K. W., Lee, J. H. 2010. Functional response of Neoseiulus californicus (Acari: Phytoseiidae) to Tetranychus urticae (Acari: Tetranychidae) on strawberry leaves. Journal of Applied Entomology, 134(2), 98-104. https://doi.org/10.1111/j.1439-0418.2009.01440.x
- Ali, M. P., Naif, A. A., Huang, D. 2011. Prey consumption and functional response of a phytoseiid predator, Neoseiulus womersleyi, feeding on spider mite, Tetranychus macfarlanei. Journal of Insect Science, 11(1), 167. https://doi.org/10.1093/jis/11.1.167
- Aly, M. F. 2023. Biological Control of Two-Spotted Spider Mite, Tetranychus urticae with Predatory Phytoseiid Mites Neoseiulus californicus and Amblyseius swirskii in Strawberry (Acari: Tetranychidae: Phytoseiidae). Journal of Plant Protection and Pathology, 14(3), 83-88. https://doi.org/10.21608/jppp.2023.194439.1135
- Bazgir, F., Shakarami, J., Jafari, S. 2018. Life table and predation rate of Amblyseius swirskii (Acari: Phytoseiidae) fed on Eotetranychus frosti (Tetranychidae) and Cenopalpus irani (Tenuipalpidae). Systematic and Applied Acarology, 23(8), 1614-1626. https://doi.org/10.11158/saa.23.8.11
- Bazgir, F., Shakarami, J., Jafari, S. 2020. Functional response of the predatory mite Amblyseius swirskii (Acari: Phytoseiidae) to Eotetranychus frosti (Tetranychidae) and Cenopalpus irani (Tenuipalpidae). Acarologia, 60(1), 30-39. https://doi.org/10.24349/acarologia/20204359
- Bielza P. 2016. Insecticide Resistance in Natural Enemies. In: Horowitz, A., Ishaaya, I. (eds) Advances in Insect Control and Resistance Management. Springer, Cham. 313-329. https://doi.org/10.1007/978-3-319-31800-4_16
- Calvo, F. J., Bolckmans, K., Belda, J. E. 2012. Biological control-based IPM in sweet pepper greenhouses using Amblyseius swirskii (Acari: Phytoseiidae). Biocontrol Science and Technology, 22(12), 1398-1416. https://doi.org/10.1080/09583157.2012.731494
- Calvo, F. J., Knapp, M., van Houten, Y. M., Hoogerbrugge, H., Belda, J. E. 2015. Amblyseius swirskii: what made this predatory mite such a successful biocontrol agent?. Experimental and Applied Acarology, 65(4), 419-433. https://doi.org/10.1007/s10493-014-9873-0
- Chow, A., Chau, A., Heinz, K. M. 2010. Compatibility of Amblyseius (Typhlodromips) swirskii (Athias-Henriot)(Acari: Phytoseiidae) and Orius insidiosus (Hemiptera: Anthocoridae) for biological control of Frankliniella occidentalis (Thysanoptera: Thripidae) on roses. Biological control, 53(2), 188-196. https://doi.org/10.1016/j.biocontrol.2009.12.008
- Carrillo, D., Pena, J. E. 2012. Prey-stage preferences and functional and numerical responses of Amblyseius largoensis (Acari: Phytoseiidae) to Raoiella indica (Acari: Tenuipalpidae). Experimental and Applied Acarology, 57, 361-372. https://doi.org/10.1007/s10493-011-9488-7
- Claver, M.A., Ravichandran B., Khan M.M., Ambrose D.P. 2003. Impact of cypermethrin on the functional response, predatory and mating behaviour of a non‐target potential biological control agent Acanthaspis pedestris (Stål) (Het., Reduviidae). Journal of Applied Entomology, 127(1): 18-22. https://doi.org/10.1046/j.1439-0418.2003.00654.x
- da Silveira, E. C., Reis, P. R., Siqueira, M. F., Toledo, M. A., Liska, G. R., Cirillo, M. Â. 2020. Functional response of Euseius concordis feeding on Oligonychus ilicis (Acari: Phytoseiidae, Tetranychidae). Experimental and Applied Acarology, 80, 215-226. https://doi.org/10.1007/s10493-019-00454-5
- Demard, E. P., Qureshi, J. A. 2023. Prey suitability and life table analysis of Amblyseius swirskii and Amblyseius aerialis (Parasitiformes: Phytoseiidae) on Panonychus citri (Acariformes: Tetranychidae) and Phyllocoptruta oleivora (Acariformes: Eriophyidae). Biological Control, 182, 105232. https://doi.org/10.1016/j.biocontrol.2023.105232
- Demirtaş, B., Birgücü, A. K., Ay, R. 2022. Acute and chronic effects of two insecticide-acaricides on the predatory mite Amblyseius swirskii Athias-Henriot. International Journal of Acarology, 48(4-5), 324-330. https://doi.org/10.1080/01647954.2022.2070668
- Doğan, C., Kumral, N.A. 2025. Comparative Age-Stage, Two-Sex Life Table Analysis of Native and Abamectin and Bifenazate-Resistant Populations of Amblyseius swirskii Athias-Henriot (Acari: Phytoseiidae) under Laboratory Conditions. Crop Protection, 107293. https://doi.org/10.1016/j.cropro.2025.107293
- Döker, İ., Kazak, C., Karut, K. 2016. Functional response and fecundity of a native Neoseiulus californicus population to Tetranychus urticae (Acari: Phytoseiidae, Tetranychidae) at extreme humidity conditions1. Systematic and applied acarology, 21(11), 1463-1472. https://doi.org/10.11158/saa.21.11.3
- Döker, İ., Kazak, C. 2019. Non-target effects of five acaricides on a native population of Amblyseius swirskii (Acari: Phytoseiidae). International Journal of Acarology, 45(1-2), 69-74. https://doi.org/10.1080/01647954.2018.1542457
- Elmoghazy M.M., Elsherbini D.M.A., Mashlawi A.M., Ibrahim A.M., El-Mansi A.A., El-Sherbiny M. 2024. Implications of Temperature and Prey Density on Predatory Mite Amblyseius swirskii (Acari: Phytoseiidae) Functional Responses. Insects, 15(6): 444. https://doi.org/10.3390/insects15060444
- Escudero, L. A., Ferragut, F. 2005. Life-history of predatory mites Neoseiulus californicus and Phytoseiulus persimilis (Acari: Phytoseiidae) on four spider mite species as prey, with special reference to Tetranychus evansi (Acari: Tetranychidae). Biological Control, 32(3), 378-384. https://doi.org/10.1016/j.biocontrol.2004.12.010
- Fantinou, A. A., Baxevani, A., Drizou, F., Labropoulos, P., Perdikis, D., Papadoulis, G. 2012. Consumption rate, functional response and preference of the predaceous mite Iphiseius degenerans to Tetranychus urticae and Eutetranychus orientalis. Experimental and Applied Acarology, 58, 133-144. https://doi.org/10.1007/s10493-012-9557-6
- Farazmand, A., Fathipour, Y., Kamali, K. 2012. Functional response and mutual interference of Neoseiulus californicus and Typhlodromus bagdasarjani (Acari: Phytoseiidae) on Tetranychus urticae (Acari: Tetranychidae). International Journal of Acarology, 38(5), 369-376. https://doi.org/10.1080/01647954.2012.655310
- Farazmand, A., Amir-Maafi, M. 2021. Use of functional response modeling to evaluate the effect of temperature on predation of Amblyseius swirskii (Acari: Phytoseiidae) adults preying on Tetranychus urticae (Acari: Tetranychidae) nymphs. Journal of Economic Entomology, 114(6), 2271-2276. https://doi.org/10.1093/jee/toab171
- Fathipour, Y., Karimi, M., Farazmand, A., Ali, A. T. 2017a. Age-specific functional response and predation capacity of Phytoseiulus persimilis (Phytoseiidae) on the two-spotted spider mite. Acarologia, 58(1), 31-40. https://doi.org/10.24349/acarologia/20184225
- Fathipour, Y., Karimi, M., Farazmand, A., Talebi, A. A. 2017b. Age-specific functional response and predation rate of Amblyseius swirskii (Phytoseiidae) on two-spotted spider mite. Systematic and Applied Acarology, 22(2), 159-169. https://doi.org/10.11158/saa.22.2.1
- Fathipour, Y., Maleknia, B., Bagheri, A., Soufbaf, M., Reddy, G. V. 2020. Functional and numerical responses, mutual interference, and resource switching of Amblyseius swirskii on two-spotted spider mite. Biological Control, 146, 104266. https://doi.org/10.1016/j.biocontrol.2020.104266
- Fiedler, Ż., Sosnowska, D. 2012. Biological control of the spider mite Tetranychus urticae and interaction between beneficial organisms on vegetable crops in greenhouses. Cabi Digital Library, 80, 205-210.
- Golshan, R., Shishehbor, P., Esfandiari, M. 2023. Biological characteristics, functional and numerical responses of the predatory mite Amblyseius swirskii feeding on cotton whitefly, Bemisia tabaci. Journal of Entomological Society of Iran, 43(2), 97-111. https://doi.org/10.61186/jesi.43.2.2
- Göksel, P. H., Kumral, N. A. 2022. Which plant species is more suitable for the control of Tetranychus urticae with Amblyseius swirskii? IV. Balkan Agricultural Congress, 31 August-02 September 2022, Edirne, Turkey.
- Gu, D.J. 1991. Influence of sublethal dose of insecticides on the foraging behavior of Diaeretirlla rapae. Acta Ecol. Sin. 11: 324-329.
- Hassell, M. P., Lawton, J. H., Beddington, J. R. 1977. Sigmoid functional responses by invertebrate predators and parasitoids. The Journal of Animal Ecology, 249-262. https://doi.org/10.2307/3959
- Havasi, M., Alsendi, A., Bozhgani, N. S. S., Kheradmand, K., Sadeghi, R. 2021. The effects of bifenazate on life history traits and population growth of Amblyseius swirskii Athias-Henriot (Acari: Phytoseiidae). Systematic and Applied Acarology, 26(3), 610-623. https://doi.org/10.11158/saa.26.3.10
- Helle, W., Sabelis, M. W. (Eds.). 1985. Spider mites: their biology, natural enemies and control (Vol. 1, pp. 141-160). Amsterdam: Elsevier.
- Holling, C. S. 1959. Some characteristics of simple types of predation and parasitism1. The canadian entomologist, 91(7), 385-398. https://doi.org/10.4039/Ent91385-7
- Hull, L. A., Asquith, D., Mowery, P. D. 1977. The mite searching ability of Stethorus punctum within an apple orchard. Environmental Entomology, 6(5), 684-688. https://doi.org/10.1093/ee/6.5.684
- Kasap I., Atlihan R. 2011. Consumption rate and functional response of the predaceous mite Kampimodromus aberrans to two-spotted spider mite Tetranychus urticae in the laboratory. Experimental and Applied Acarology, 53: 253-261. https://doi.org/10.1007/s10493-010-9400-x
- Knapp, M., van Houten, Y., van Baal, E., Groot, T. 2018. Use of predatory mites in commercial biocontrol: current status and future prospects. Acarologia, 58(Suppl), 72-82. DOI 10.24349/acarologia/20184275 https://doi.org/10.24349/acarologia/20184275
- Kolcu, A., Kumral, N. A. 2023. The toxic effects of some acaricides on the tomato russet mite and its predator Amblyseius swirskii Athias-Henriot, 1962 (Acari: Phytoseiidae). Turkish Journal of Entomology, 47(1), 3-13. https://doi.org/10.16970/entoted.1171756
- Kouhjani Gorji, M., Fathipour, Y., Kamali, K. 2009. The effect of temperature on the functional response and prey consumption of Phytoseius plumifer (Acari: Phytoseiidae) on the two-spotted spider mite. Acarina, 7(2): 231-237.
- Kumral, N.A., Çobanoğlu, S., Hephızlı G.P., Aksoy, A., 2021. Toxic effects of some acaricides on Aceria oleae (Nalepa, 1900) (Acari: Eriophyidae) and its predator Neoseiulus californicus (McGregor, 1954) (Acari: Phytoseiidae) under laboratory conditions. Turkish. J. Entomol., 45(4), 485-498. https://doi.org/10.16970/entoted.999028
- Li, D.X., Tian J., Shen Z.R. 2006. Effects of pesticides on the functional response of predatory thrips, Scolothrips takahashii to Tetranychus viennensis. Journal of Applied Entomology, 130(5): 314-322. https://doi.org/10.1111/j.1439-0418.2006.01056.x
- Liang, J., Tang S., Cheke R.A., Wu J. 2015. Models for determining how many natural enemies to release inoculatively in combinations of biological and chemical control with pesticide resistance. Journal of Mathematical Analysis and Applications, 422(2): 1479-1503. https://doi.org/10.1016/j.jmaa.2014.09.048
- Lopez, L. 2023. Meet Amblyseius swirskii (Acari: Phytoseiidae): a commonly used predatory mite in vegetable crops. Journal of Integrated Pest Management, 14(1), 20. https://doi.org/10.1093/jipm/pmad018
- Maroufpoor, M. 2017. The two-sex life table of the predatory mite Amblyseius swirskii fed on Phyllocoptes adalius in laboratory conditions. Applied Entomology and Phytopathology, 83(2), 189-200. http://dx.doi.org/10.22092/jaep.2016.106116
- Mertoğlu, B.G., Tixier, M.S., Douin, M., Kumral, N.A. 2024. Genetic and morphological features of some Turkish populations of Amblyseius swirskii (Athias-Henriot) (Acari: Phytoseiidae). Acarologia 64(4): 1163-1174. https://doi.org/10.24349/la7w-80ps
- McMurtry, J. A., Croft, B. A. 1997. Life-styles of phytoseiid mites and their roles in biological control. Annual review of entomology, 42(1), 291-321. https://doi.org/10.1146/annurev.ento.42.1.291
- McMurtry, J. A., De Moraes, G. J., Sourassou, N. F. 2013. Revision of the lifestyles of phytoseiid mites (Acari: Phytoseiidae) and implications for biological control strategies. Systematic and Applied Acarology, 18(4), 297-320. https://doi.org/10.11158/saa.18.4.1
- Mohaghegh, C., Tirry D. 2001. Functional response of the predators Podisus maculiventris (Say) and Podisus nigrispinus (Dallas)(Het., Pentatomidae) to the beet armyworm, Spodoptera exigua (Hübner)(Lep., Noctuidae): effect of temperature. Journal of Applied Entomology, 125(3): 131-134. https://doi.org/10.1046/j.1439-0418.2001.00519.x
- Momen, F. M. and Elsaway, S. A. 1993. Biology and feeding behavior of the predatory mite, Amblyseius swirskii (Acari, Phytoseiidae). Acarologia, 34(3): 199 -204.
- Mousavi, A., Kheradmand, K., Fathipour, Y., Mosallanejad, H., Havasi, M. 2022. Sublethal effects of Milbemectin on biological parameters of Amblyseius swirskii (Acari: Phytoseiidae). Systematic and Applied Acarology, 27(6), 1085-1097. https://doi.org/10.11158/saa.27.6.8
- Mousavi, A., Kheradmand, K., Fathipour, Y., Mosallanejad, H., Havasi, M. 2023. The effects of the abamectin and spirodiclofen mixture on life history and population parameters of Amblyseius swirskii. Systematic and Applied Acarology, 28(5), 971-984. https://doi.org/10.11158/saa.28.5.16
- Mortazavi, N., Fathipour, Y., Talebi, A. A. 2019. The efficiency of Amblyseius swirskii in control of Tetranychus urticae and Trialeurodes vaporariorum is affected by various factors. Bulletin of Entomological Research, 109(3), 365-375. https://doi.org/10.1017/S0007485318000640
- Overmeer, W.P.J., van Zon A.Q., 1982. A standardized method for testing the side effects of pesticides on the predacious mite, Amblyseius potentillae (Acarina: Phytoseiidae). Entomophaga, 27(4), 357-363. https://doi.org/10.1007/BF02372057
- Park, H. H., Shipp, L., Buitenhuis, R., Ahn, J. J. 2011. Life history parameters of a commercially available Amblyseius swirskii (Acari: Phytoseiidae) fed on cattail (Typha latifolia) pollen and tomato russet mite (Aculops lycopersici). Journal of Asia-Pacific Entomology, 14(4), 497-501. https://doi.org/10.1016/j.aspen.2011.07.010
- Park, Y. G., Lee, J. H., Lim, U. T. 2021. Functional response of Amblyseius eharai (Acari: Phytoseiidae) on Tetranychus urticae (Acari: Tetranychidae). Plos one, 16(12), e0260861. https://doi.org/10.1371/journal.pone.0260861
- Pervez, A., Omkar. 2006. Ecology and biological control application of multicoloured Asian ladybird, Harmonia axyridis: A review. Biocontrol science and technology, 16(2), 111-128. https://doi.org/10.1080/09583150500335350
- Potter C. 1952. An improved apparatus for applying direct sprays and surface films with data on the electrostatic charge on atomized spray fluids. Ann. Appl. Biol., 39 (1): 1-28. https://doi.org/10.1111/j.1744-7348.1952.tb00993.x
- PPDB database, 2024. PPDB: Pesticides DataBase. The University of Hertfordshire. https://sitem.herts.ac.uk/aeru/ppdb/
- Rogers, D. 1972. Random search and insect population models. The Journal of Animal Ecology, 369-383. https://doi.org/10.2307/3474
- Seiedy, M., Saboori, A., Allahyari, H., Talaei-Hassanloui, R., Tork, M. 2012. Functional response of Phytoseiulus persimilis (Acari: Phytoseiidae) on untreated and Beauveria bassiana-treated adults of Tetranychus urticae (Acari: Tetranychidae). Journal of Insect Behavior, 25, 543-553. https://doi.org/10.1007/s10905-012-9322-z
- Sepúlveda, F., Carrillo, R. 2008. Functional response of the predatory mite Chileseius camposi (Acarina: Phytoseiidae) on densities of it prey, Panonychus ulmi (Acarina: Tetranychidae). Revista de Biología Tropical, 56(3), 1255-1260. https://doi.org/10.15517/rbt.v56i3.5707
- Shen X.Q., Zhang Y.N., Li T., Jiang J.Y.Q., Zhang, J.P. 2017. Toxicity of three acaricides to the predatory mite, Neoseiulus bicaudus (Acari: Phytoseiidae) and their impact on the functional response to Tetranychus turkestani (Acari: Tetranychidae). Journal of Economic Entomology, 110(5): 2031-2038. https://doi.org/10.1093/jee/tox206
- Shirvani, Z., Döker, I., Karut, K., Kazak, C. (2023). Foraging behavior of Amblyseius swirskii (Acari: Phytoseiidae) feed on the invasive pest Tetranychus evansi (Acari: Tetranychidae) on tomato. Systematic and Applied Acarology, 28(2), 223-235. https://doi.org/10.11158/saa.28.2.6
- Soleymani, S., Hakimitabar, M., Seiedy, M. 2016a. Prey preference of predatory mite Amblyseius swirskii (Acari: Phytoseiidae) on Tetranychus urticae (Acari: Tetranychidae) and Bemisia tabaci (Hemiptera: Aleyrodidae). Biocontrol Science and Technology, 26(4), 562-569. https://doi.org/10.1080/09583157.2015.1133808
- Soleymani, S., Hakimitabar, M., Seiedy, M. 2016b. Food preference of Amblyseius swirskii (Acari: Phytoseiidae) on different stages of Tetranychus urticae (Acari: Tetranychidae) and Bemisia tabaci (Hemiptera: Aleyrodidae). Persian Journal of Acarology, 5(1). https://doi.org/10.1080/09583157.2015.1133808
- Song, Z. W., Zheng, Y., Zhang, B. X., Li, D. S. 2016. Prey consumption and functional response of Neoseiulus californicus and Neoseiulus longispinosus (Acari: Phytoseiidae) on Tetranychus urticae and Tetranychus kanzawai (Acari: Tetranychidae). Systematic and Applied Acarology, 21(7), 936-946. https://doi.org/10.11158/saa.21.7.7
- Tabashnik, B.E., Johnson M.W. 2018. Laboratory selection for pesticide resistance in natural enemies. In: Applications of Genetics to Arthropods of Biological Control Significance. CRC Press, 91-106. https://doi.org/10.1201/9781351069762
- Van Nieuwenhuyse, P., Demaeght, P., Dermauw, W., Khalighi, M., Stevens, C. V., Vanholme, B., Van Leeuwen, T. 2012. On the mode of action of bifenazate: new evidence for a mitochondrial target site. Pesticide Biochemistry and Physiology, 104(2), 88-95. https://doi.org/10.1016/j.pestbp.2012.05.013
- Veeravel, R., Baskaran, P. 1997a. Functional and numerical Responses of Coccinella transversalis Fab. and Cheilomenes sexmaculatus fab. feeding on the Melon Aphid, Aphis gossypii Glov. International Journal of Tropical Insect Science, 17(3-4), 335-339. https://doi.org/10.1017/S1742758400019159
- Veeravel, R., Baskaran P. 1997b. Searching behaviour of two coccinellid predators, Coccinella transversalis fab. and Cheilomenes sexmaculatus fab., on egg plant infested with Aphis gossypii Glov. International Journal of Tropical Insect Science, 17(3-4): 363-368. https://doi.org/10.1017/S1742758400019159
- Wang, X.Y., Shen Z.R. 2002. Effects of sublethal doses of insecticides on predation of multicolored asian ladybird Harmonia axyridis (Pallas) (Coleoptera: Coccinelliodae). Acta Ecol Sin, 22(12): 2278-2284.
- Xiao, Y., Osborne, L. S., Chen, J., McKenzie, C. L. 2013. Functional responses and prey-stage preferences of a predatory gall midge and two predacious mites with twospotted spider mites, Tetranychus urticae, as host. Journal of Insect Science, 13(1), 8. https://doi.org/10.1673/031.013.0801
- Yan-Xuan, C., Jian-zhen, L. I. N. 2011. Experimental life table for population of Amblyseius swirskii (Athias-Henriot) fed on Tetranychus truncatus (Ehara). Fujian Journal of Agricultural Sciences, 26(3), 415-419.
- Yao, H., Zheng, W., Tariq, K., Zhang, H. 2014. Functional and numerical responses of three species of predatory phytoseiid mites (Acari: Phytoseiidae) to Thrips flavidulus (Thysanoptera: Thripidae). Neotropical Entomology, 43, 437-445. https://doi.org/10.1007/s13744-014-0229-6
- Yari, S., Hajiqanbar, H., Farazmand, A., Rashed, A., Fathipour, Y. 2023. Efficacy of single and combined release of Phytoseiulus persimilis and Amblyseius swirskii at different release ratios for control of Tetranychus urticae and Frankliniella occidentalis on rose plants. International Journal of Pest Management, 1-11. https://doi.org/10.1080/09670874.2023.2185312
- Zhang, Y. N., Jiang, J. Y. Q., Zhang, Y. J., Qiu, Y., Zhang, J. P. 2017. Functional response and prey preference of Neoseiulus bicaudus (Mesostigmata: Phytoseiidae) to three important pests in Xinjiang, China. Environmental Entomologbey, 46(3), 538-543. https://doi.org/10.1093/ee/nvx073


2025-04-16
Date accepted:
2025-07-05
Date published:
2025-07-21
Edited by:
Marčić, Dejan

This work is licensed under a Creative Commons Attribution 4.0 International License
2025 Doğan, Ceren and Kumral, Nabi Alper
 Download article
Download the citation
RIS with abstract
(Zotero, Endnote, Reference Manager, ProCite, RefWorks, Mendeley)
RIS without abstract
BIB
(Zotero, BibTeX)
TXT
(PubMed, Txt)