


Water mites and their use as bioindicators of water quality conditions: a Pennsylvania case study
Stenger, Logan R.  1
; Ferguson, Francesca M.
2
and Skvarla, Michael
3
1
; Ferguson, Francesca M.
2
and Skvarla, Michael
3
1✉ The Pennsylvania State University, Department of Entomology, University Park, Pennsylvania, U.S.A.
2The Pennsylvania State University, Huck Institute of the Life Sciences, University Park, Pennsylvania, U.S.A.
3The Pennsylvania State University, Department of Entomology, University Park, Pennsylvania, U.S.A.
2024 - Volume: 64 Issue: 1 pages: 146-163
https://doi.org/10.24349/qo5i-rvldOriginal research
Keywords
Abstract
Introduction
Freshwater environments are one of the most ecologically and economically important ecosystems in the world. Unfortunately, anthropogenic activities (e.g., agriculture, logging, and development) can significantly alter freshwater quality making them one of the most impaired ecosystems (Peters and Meybeck 2000; Dodds et al. 2013). In the United States alone, roughly 50% of all surveyed streams and rivers (~1.1 million km) are degraded to the point of being classified as ''impaired'' for failing to meet water quality standards (Kelderman et al. 2022). Thus, biologists from state and national agencies continuously monitor pollutants in streams and rivers, allowing natural resource managers to mitigate problems when they arise promptly.
One of the most common methods for assessing water quality involves measuring a waterways physical and chemical (i.e., physicochemical) attributes. While physicochemical data are important and can provide insights into pollution events and sources, long-term data are needed to fully understand water quality conditions. However, this monitoring requires high-frequency sampling that can be time-consuming and expensive (Kirchner et al. 2004). Without long-term physicochemical data, determining water quality can be challenging as individual water samples only reflect conditions at the time of collection (Metcalfe 1989). Additionally, many abiotic factors such as season, weather, flow events, and time the sample was collected can influence physicochemical conditions yearly, monthly, daily, or even hourly. To combat this temporal limitation of water quality data, scientists can incorporate biological water quality monitoring, or ''biomonitoring,'' into water quality assessments to account for this variability, as biological communities can reflect cumulative effects of physical and chemical stressors within an aquatic environment (Yoder and Rankin 1998; Stribling et al. 2016).
Benthic macroinvertebrates are commonly assessed in biomonitoring strategies over other aquatic organisms (e.g., fish and periphyton) due to their relative abundance in aquatic systems, sessile lifestyle, and ease of collection and identification (Rosenberg and Resh 1993; Barbour et al. 1999). In fact, many state and national policies encourage the use of benthic macroinvertebrates in biomonitoring strategies to inform and guide freshwater management and protection decisions (Metcalfe 1989, Yoder and Rankin 1998; Bonada et al. 2006; Kenney et al. 2009). By examining abundance and diversity of macroinvertebrate assemblages at various taxonomic levels (e.g., family, genus, or species), scientists can calculate metrics, such as the Index of Biotic Integrity (IBI), to discern unpolluted ''attaining'' and polluted ''impaired'' water quality conditions (Barbour et al. 1999; Shull and Whiteash 2021). In Pennsylvania, the Department of Environmental Protection (PADEP) calculates IBI scores by combining six standardized community composition metrics into one score that ranges from 0–100, where greater values indicate better water quality (Shull and Whiteash 2021). While calculating IBI scores are standard practice and account for most aquatic invertebrates, some taxa are not included in these scores. For instance, water mites are widely neglected in global freshwater biomonitoring strategies (Goldschmidt 2016). In fact, in most biomonitoring protocols, including Pennsylvania's (Chalfant 2021a), water mites are either ignored entirely or identified collectively as ''Hydracarina'' or ''Hydrachnidia,'' an artificial grouping of several water mite superfamilies (Goldschmidt 2016; Stenger and Skvarla 2022).
However, water mites are one of the world's most diverse and abundant groups of benthic macroinvertebrates, with over 7,500 described species representing more than 400 genera, 56 families, and 7 superfamilies. Acarologists conservatively estimate that another 4,000 species have yet to be discovered (Di Sabatino et al. 2008; Smit 2020). Water mites occur worldwide, except in Antarctica, and can be found in nearly every known lentic and lotic freshwater environment (Di Sabatino et al. 2008). In lotic systems, water mites are commonly found in fast-flowing, riffle-run stream habitats, which are often targeted for standard biomonitoring assessments, where a single square meter of substrate can contain as many as 5,000 individual mites representing more than 50 species, 30 genera, and all 7 superfamilies (Smith et al. 2010; Stenger and Skvarla 2022). In addition, water mites exhibit complex life cycles that are closely connected with benthic macroinvertebrate assemblages as their larvae parasitize various aquatic invertebrates, while deutonymphs and adults are predators (Di Sabatino et al. 2000; Smith et al. 2010).
Due to these characteristics, the relationship between water mites and water quality dates back to the early 20th century, originating in Europe (Miccoli et al. 2013). Since then, several studies across the globe have determined that water mites can be useful bioindicators of water quality, including in Australia (Growns 2001), Bhutan (Gurung et al. 2022), Costa Rica (Goldschmidt 2009), Germany (Gerecke and Schwoerbel 1991), Italy (Cicolani et al. 2009; Miccoli et al. 2013), Panama (Goldschmidt et al. 2016), Poland (Zawal et al. 2017), Romania (Cîmpean 2010), and the United States (Vasquez et al. 2022). Despite this evidence, water mites continue to be neglected in global freshwater biomonitoring strategies (Goldschmidt 2016). In addition, the group ''Hydracarina'' is generally considered tolerant to high levels of pollution. By making this assumption, scientists fail to account for a diverse group of benthic macroinvertebrates whose inclusion in bioassessments could provide further information on water quality.
The Commonwealth of Pennsylvania, U.S.A., contains nearly 86,000 miles of freshwater streams, with approximately one-third of these streams listed as ''impaired'' and considered too polluted to support aquatic life, clean drinking water, or safe recreational activities (PADEP 2022). In addition, there has been relatively little work done on water mites within the state and few systematic collection efforts (Table 1). Pennsylvania, therefore, provides a great opportunity to examine whether water mites, like other groups of benthic macroinvertebrates, can be used to differentiate streams with varying water quality conditions.


This study aimed to improve our understanding of lotic water mites and their utility as water-quality bioindicators. While our data represents a relatively limited region, our results are likely translatable to much of the eastern United States. This effort is, in part, a response to the call for collaboration on furthering knowledge in this field (Goldschmidt 2016). We examined water mites from high-quality, cold-water streams with known ''attaining'' (meets water quality standards) and ''impaired'' (fails to meet one or more water quality standards) conditions (PADEP 2022). In addition, we performed PADEP benthic macroinvertebrate and physicochemical water quality assessments to confirm each stream's pollution status and for further comparison to the water mite assemblages. The objectives of this study were to: 1) identify and inventory water mite taxa from cold-water, riffle-run stream habitats, 2) determine if water mite assemblages vary across attaining and impaired streams, and 3) determine how biological and physicochemical conditions influence water mite assemblages.
Methods
Site selection
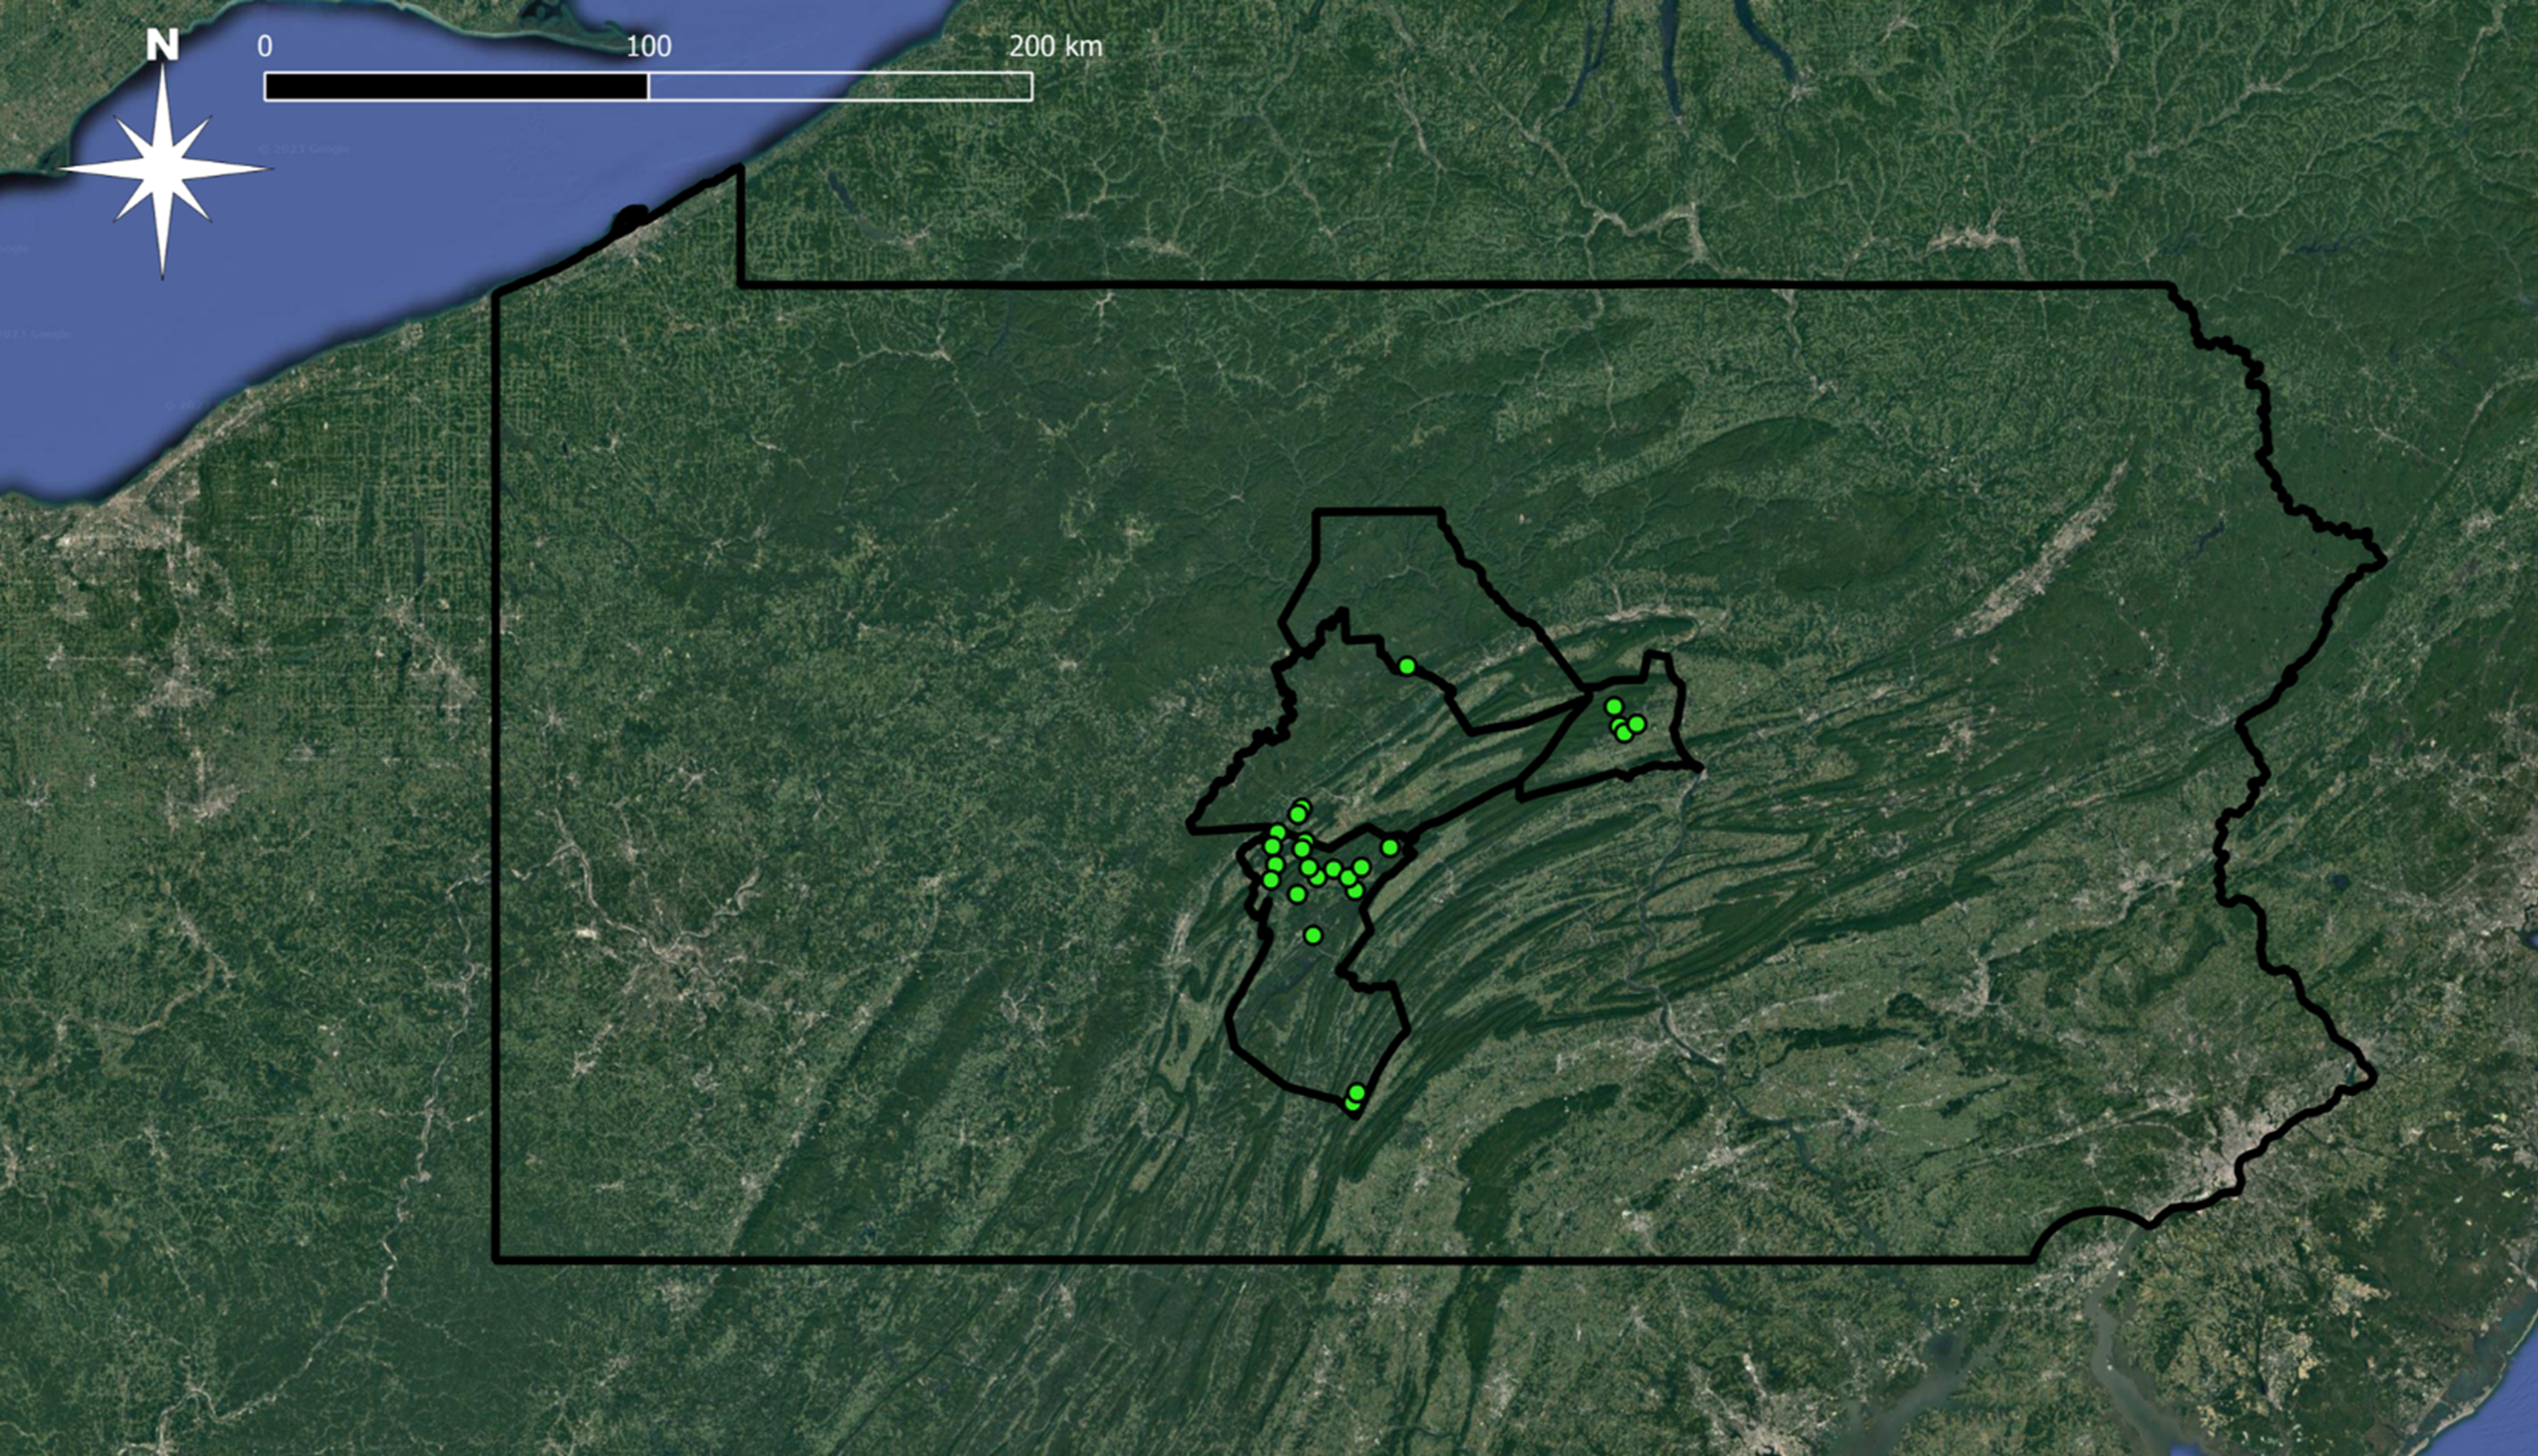
We considered four factors when selecting sites: 1) geographic distribution, 2) designated use, 3) pollution status (attaining or impaired), and 4) access. In total, 26 sites were selected from a four-county region in central Pennsylvania, U.S.A (Figure 1, Table 2). All sites are within the Susquehanna River Basin, Pennsylvania's largest watershed that has also been scrutinized for its pollution contribution in the Chesapeake Bay, the largest estuary in the United States (e.g., Goldberg et al. 1978; Ko and Baker 2004; Zhang et al. 2013). Sites are distributed across 12 different HUC-12 subwatersheds (USGS 2022). In addition, all sites were along streams designated by PADEP as high-quality, cold-water fishery (HQ-CWF) streams. Only 30% of Pennsylvania's streams are designated as HQ-CWF as these streams are the ''best of the best'' and, therefore, receive some of the highest levels of protection, such as narrower impairment thresholds (Shull and Whiteash 2021).

We initially selected a total of 15 attaining and 11 impaired sites after reviewing the Pennsylvania Department of Environmental Protection's 2020 Integrated Water Quality Report (PADEP 2020; Figures 2 and 3). To ensure impaired streams were comparable, we only selected streams designated with agriculture as the impairment source for this study. Upon completing this study's benthic macroinvertebrate assessments (see details below), we determined that 13 of the 15 attaining sites met water quality standards; however, two sites did not and were redesignated as impaired for this study (see Results below). Therefore, our study compared water mite communities between 13 attaining and 13 impaired streams.

When selecting sites, we also took accessibility into account. Therefore, to the best of our ability, we selected publicly accessible sites or, when necessary, acquired landowner permission prior to any sampling efforts.

Water Mite Collection
For this study, we collected water mites at 23 sites in 2021 and 3 additional sites in 2022, between 1 August and 31 August, when water mites are typically most abundant (Meyer 1994; Gerecke 2002; Stenger 2023). We collected water mites using a quantitative protocol for lotic, riffle-run habitats (Stenger and Skvarla 2022). We developed this collection protocol by modifying qualitative collection methods proposed (Smith et al. 2010) and incorporating benthic macroinvertebrate collection standardizations from the Wadeable Riffle-Run Stream Macroinvertebrate Data Collection Protocol (Chalfant 2021a). Briefly, at each of our sampling sites, we first delineated a 100-meter reach. Within our reach, we used a spade foot shovel and a 250 µm mesh non-truncated D-frame net, disturbing four one-square meter substrate areas within riffle-run habitats. The contents from all four collections were then composited into one large plastic sampling container. We then rinsed and sieved the composite sample using stream water and a 3 mm sieve stacked on top of a 250 µm sieve ten times. We then used a spoon to collect the contents from the 250 µm sieve, transferred it into a labeled 50 mL sampling container, and filled it with stream water. The samples were then returned to the lab in a cooler, transferred into a white sorting tray, and allowed to sit undisturbed for 20-30 minutes. We then collected mites using a pipette and transferred them into a 4-dram glass vial. After six hours of collecting mites, we removed excess water from the 4-dram glass vial and preserved the mites in 80% ethanol until identification. We identified all mites (except Oribatids) to genus using keys (Smit 2020 and Smith et al. 2010). We then preserved all collected specimens in 70 – 80% ethanol and accessioned them in the Frost Entomological Museum at the Pennsylvania State University in State College, PA, U.S.A. We collected all water mites and benthic macroinvertebrate samples under Pennsylvania Fish and Boat Commission Type I Scientific Collector Permit Numbers 2021–01–0017 and 2022–01–0147.
Environmental Variables
We collected physicochemical and biological data at each sample site to 1) confirm each site's ''attaining'' or ''impaired'' status, and 2) for use in multivariate analyses with water mite assemblages. All physicochemical and biological sampling and assessment methodologies adhered to PADEP standards (Lookenbill and Whiteash 2021; Shull and Whiteash 2021).
Physicochemical Variables
We completed physicochemical assessments in conjunction with each water mite sampling effort involving water chemistry and physical habitat measurements. We used a Yellow Springs Instrument (YSI) ProPlus 2030 multi-meter to measure water temperature (°C), specific conductance (µS/cm), and dissolved oxygen parameters (mg/L and%DO). We used a YSI pH100 Ecosense meter to measure temperature (°C) and pH standard units. We compared temperature readings for each instrument at each site to ensure meter accuracy.
Physical habitat assessments involve ranking 12 individual habitat parameters over a 100-meter sample reach as poor (1-5), marginal (6-10), suboptimal (11-15), and optimal (16-20) by assigning each parameter a value ranging from 1-20 (Shaw 2021). These parameters include instream cover, epifaunal substrate, embeddedness, velocity/depth regimes, channel alteration, sediment deposition, riffle frequency, channel flow status, condition of banks, bank vegetative protection, grazing or other disruptive pressure, and riparian vegetative zone. After all the parameters were evaluated, scores were combined to calculate a Total Habitat Score and rated as follows: poor (0–60), marginal (61–120), suboptimal (121–180), and optimal (181–240).
In addition to water chemistry and physical habitat data, we also recorded land use data using publicly available online software Model My Watershed (Stroud Water Research Center 2017). For each sample site, we determined land use by delineating the upstream drainage area (km²). For this study, we combined several land use attributes to form three primary categories, 1) Forest (combined deciduous, evergreen, and mixed forest attributes), 2) Agriculture (combined pasture/hay and cropland attributes), and 3) Urban/Developed Space (combined developed-open space, developed low intensity, developed medium intensity, and developed-high intensity attributes). Since these three primary categories composed more than 97% of the drainage area's land use, we did not include the remaining land use attributes (e.g., open water, perennial ice/snow, woody wetlands) in our analyses.
Biological Variables
Unlike water chemistry and physical habitat, which were measured the same day as the water mite collections, benthic macroinvertebrate samples were collected at each site between 1 March and 31 May in both 2021 and 2022 following PADEP protocols for wadeable, riffle-run streams (Chalfant 2021a). Benthic macroinvertebrate communities reflect the cumulative effects of environmental stressors over long durations (Yoder and Rankin 1998; Stribling et al. 2016); therefore, these data represent each stream's annual water quality conditions.
After benthic macroinvertebrates were collected and subsampled, we used an Olympus SZ61 stereomicroscope (0.67 – 4.5 magnification) and identified all individuals to the genus level, except for those taxonomic groups listed in Table 3. Author Logan Stenger is certified through the Society for Freshwater Science (formerly North American Benthological Society) for eastern EPT (Ephemeroptera, Plecoptera, and Trichoptera) and eastern General Arthropods genera and served as the primary taxonomist. Once identified, organisms were returned to the labeled vials with 70–80% ethanol. All benthic macroinvertebrate specimens were preserved and accessioned in the Frost Entomological Museum at the Pennsylvania State University in State College, PA, U.S.A.

We calculated six metrics (total taxa richness, EPT richness, Beck's index, Hilsenhoff biotic index, Shannon diversity, and percent sensitive individuals) using each site's identified benthic macroinvertebrate samples. To compare metric scores among different sample sites, each metric was standardized based on drainage area size to a value between 0–100. We then averaged the standardized scores of the six metrics to produce the final freestone index of Biological Integrity (IBI) score. As per PADEP standards for HQ-CWF streams, we considered all sites with an IBI score of less than 63 impaired and all sites with an IBI score greater than or equal to 63 attaining. A detailed description of each metric, calculation formula, and standardization process is available (Chalfant 2021b). We performed all metric calculations in Microsoft Excel (Version 2301).
Data Analyses
For each site, we calculated water mite abundance (sum of all individuals per site), richness (count of individual taxa per site), and Shannon Diversity Index, a community composition metric that incorporates both richness and evenness across a biological sample (Shannon 1948). For comparability, we used the same Shannon Diversity calculation formula described for benthic macroinvertebrate assessments (Chalfant 2021b). We used an independent two-way t-test to compare these water mite community metrics between attaining and impaired streams. We transformed abundance and richness counts to normal distributions by calculating the natural log for each metric prior to performing each t-test.
Due to issues with collinearity among environmental variables (e.g., benthic macroinvertebrate metrics were significantly correlated with habitat scores), it was difficult to complete multivariate analyses utilizing all measured environmental variables. Therefore, we completed individual Pearson's correlation tests to compare the individual strength of relationships between each environmental variable and water mite abundance, richness, and Shannon Diversity Index.
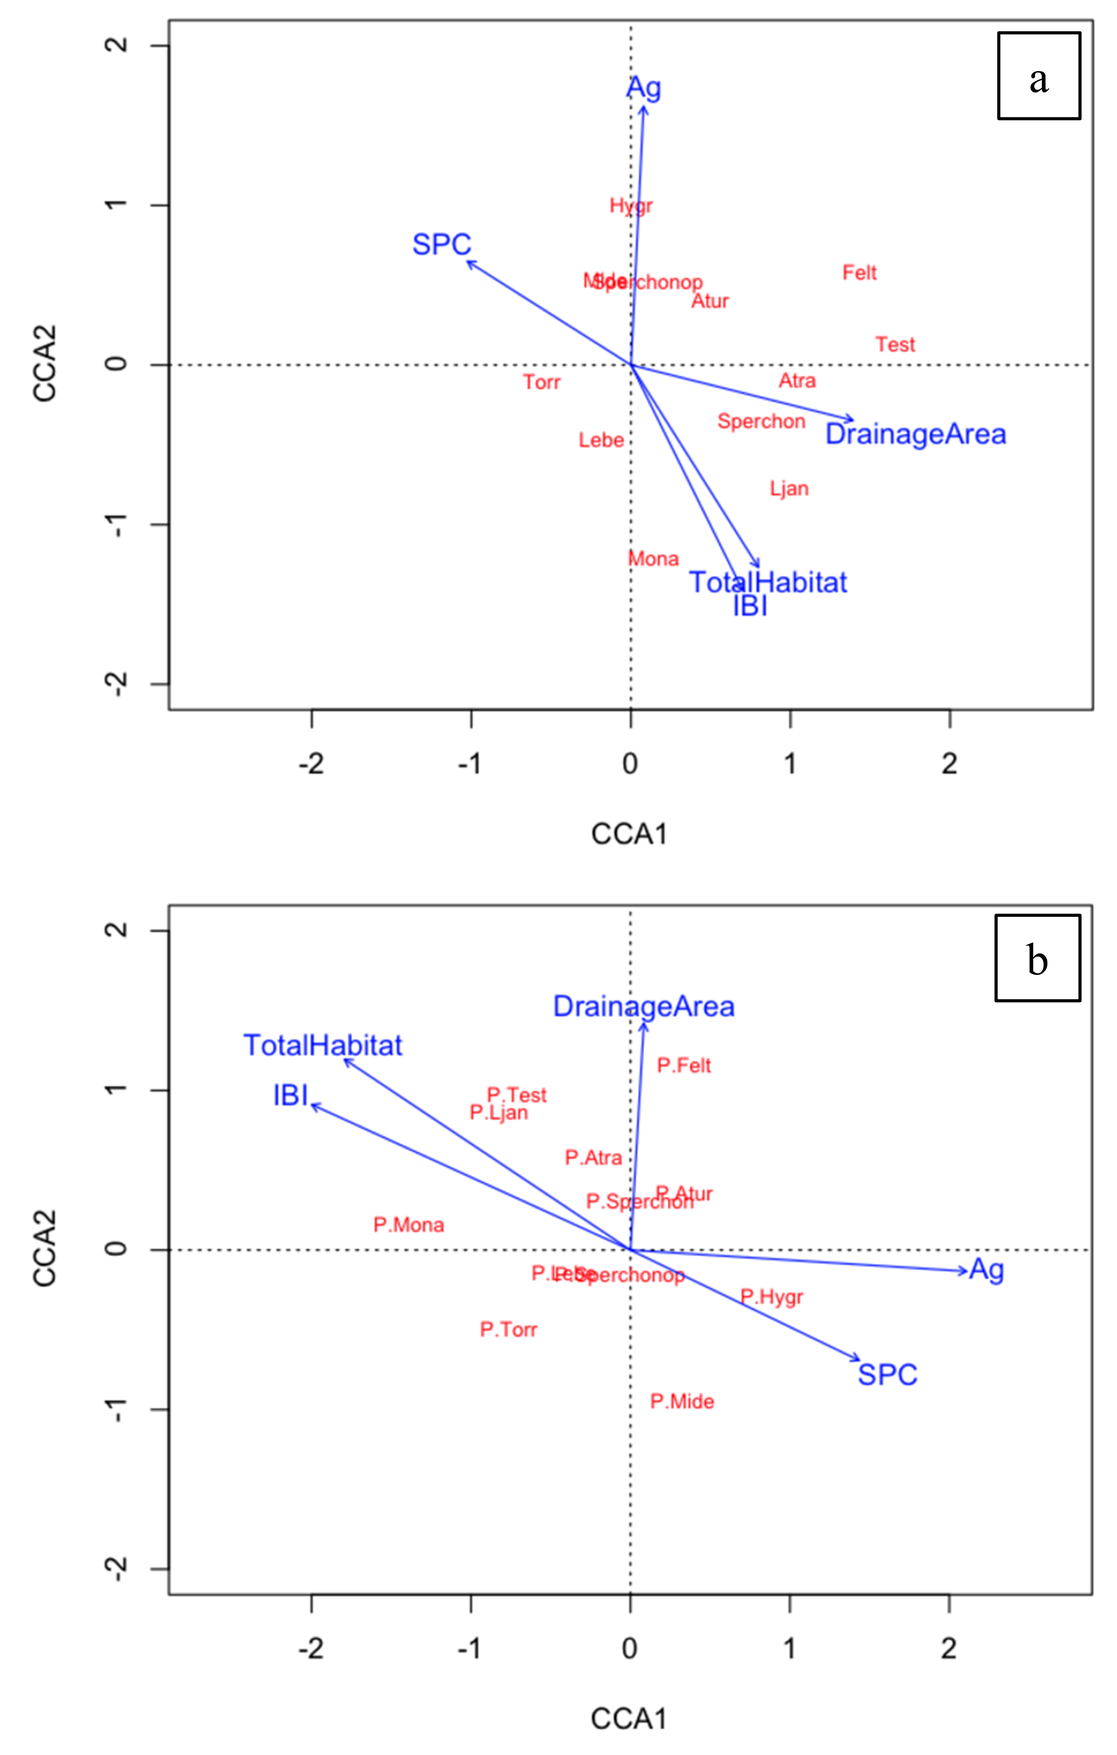
We performed a multivariate Canonical Correspondence Analysis (CCA) using the to assess water mite assemblages at the generic level for both generic abundance (sum of all individuals per genera per site) and generic composition (sum of all individuals per genus per site/sum of all individual water mites per site) to compare these assemblages to several environmental variables. In the CCA analysis, we included the environmental variables IBI, Total Habitat Score, agricultural land use, specific conductivity, and drainage area for comparison to the water mite assemblage. Specifically, we performed a variance inflation test (VIF) prior to the CCA ordination to determine the amount of collinearity among these environmental variables. We included all variables that had a VIF less than 10 for the multivariate analysis. Since the biological and habitat metrics were collinear, we selected IBI and Total Habitat Score as representative metrics for all the biological and habitat data, respectively. In the CCA, we also included specific conductivity because it was the chemical parameter with the most significant relationship with the water mite communities (see Results). Agricultural land use parameters were also included because it is considered the primary source of pollution for the impaired stream. Additionally, while drainage area was not correlated with the water mite community metrics, Pennsylvania biologists consider it an important factor when assessing streams and rivers (Chalfant 2021b). We removed the mite genera Rhyncholimnochares, Woolastookia, and Oribatida from the multivariate analysis because the recorded specimens represented less than 5% of all water mites collected. Finally, we removed the Gregory Run sample (impaired) since no water mites were collected. We performed all statistical tests in RStudio Version 1.4.1717 using the package vegan version 2.6-4. We considered alpha values less than 0.05 significant.
Results
Water mite presence and distribution
We collected and identified 9,139 water mites representing 14 genera, 9 families, and 5 superfamilies across all study sites from 2021 and 2022 (Table 4). Of the genera identified, only Testudacarus and Torrenticola had been documented in Pennsylvania prior to this study (O'Neill et al. 2016; Fisher et al. 2017). The other genera represent new state records for Pennsylvania. Five taxa were markedly abundant and composed more than 95% of all collected water mites: Torrenticola (3,242 individuals), Sperchon (1,693 individuals), Lebertia (1,693 individuals), Hygrobates (1,552 individuals), and Aturus (530 individuals).

Eight taxa were distributed across more than half of the sample sites (n=26), with Sperchon (n=25) being the most widely distributed, followed by Aturus (n=23), Hygrobates and Lebertia (n=22), Atractides and Feltria (n=16), and Sperchonopsis and Torrenticola (n=15). The remaining taxa were collected across less than 50% of the sample sites, were Monatractides and Ljania (n=8), Testudacarus (n=7), Mideopsis (n=4), Woolastookia (n =2), and Rhyncholimnochares (n=1).
In addition to true water mites, we collected two specimens belonging to the order Oribatida. Only 33 specimens (0.4% of all collected mites) were considered unidentifiable and not included in the analysis. Some of these specimens may be able to be identified further through slide mounting and examination under higher magnification.
Environmental Variables
We collected and identified 5,332 individual benthic macroinvertebrates across all study sites from 2021 and 2022. In total, this included 94 distinct taxa from 4 phyla, 7 classes, 17 orders, 54 families, and 83 genera (Table 5).

Attaining and impaired streams showed distinct differences between their biological and physical habitat attributes, with healthier streams often recording greater scores (Table 6). On average, attaining streams had higher levels of dissolved oxygen and forested land use, while impaired streams had higher levels of specific conductivity, and agricultural and urban/developed land use.

Water mite relationships with environmental variables
Independent two-way t-tests revealed significant differences between water mite richness in attaining and impaired streams (t = -2.4298, df = 24, p-value = 0.02296) and Shannon Diversity (t = -2.5093, df = 24, p-value = 0.01925) with attaining streams harboring greater diversity than impaired streams. Water mite abundance was not significantly different between attaining and impaired streams (t = -0.89302, df = 24, p-value = 0.3807).
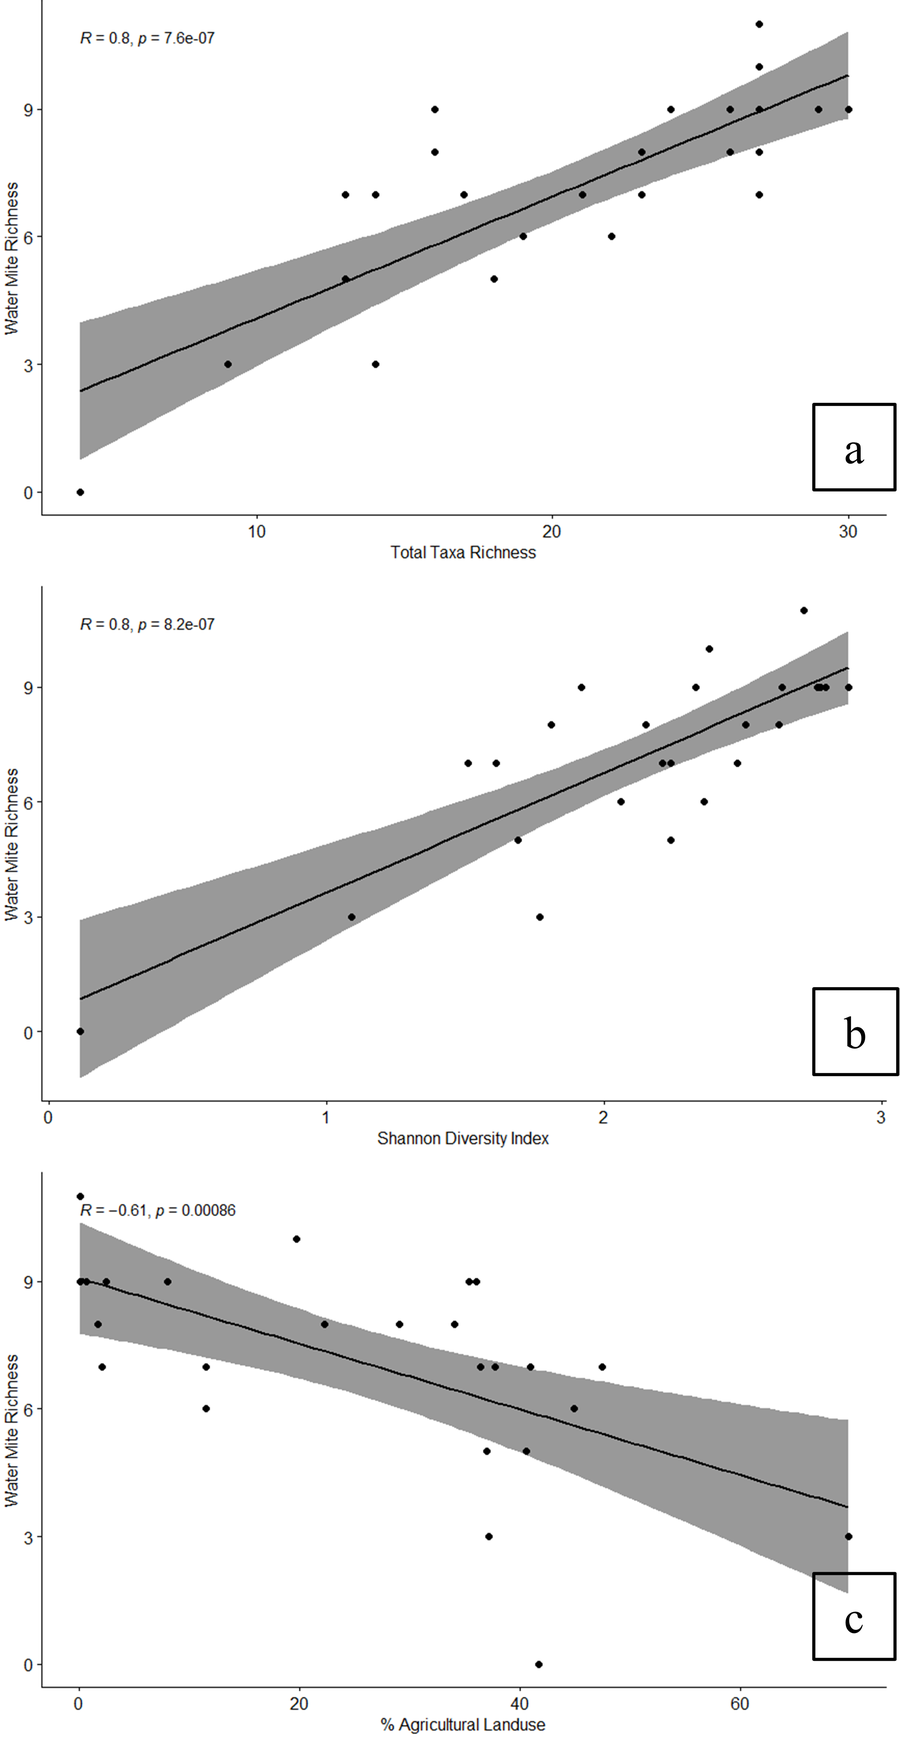
Pearson's correlation tests between the environmental variables and water mite assemblage metrics revealed several significant correlations (Table 7). Water mite abundance was not significantly correlated with any environmental variables; however, richness and Shannon Diversity exhibited moderate to strong correlations with nearly all biological metrics, habitat parameters, and several chemical and land use parameters. Specifically, water mite richness showed the strongest, positive correlation with macroinvertebrate total taxa richness (R = 0.80, p < 0.01) and Shannon Diversity (R = 0.80, p < 0.01). The strongest negative correlation was found between water mite richness and agricultural land use (R = –0.61, p < 0.01), (Figure 4).

Generic-level comparisons with environmental variables using CCA
The environmental-constrained CCA ordinations showed distinct relationships between the water mite genera and selected environmental variables (Figure 5). Environmental variables explained 57.5% of total variation in generic abundance, with 32.4% on the first axis (CA1) and 25.1% on the second axis (CA2). Environmental variables explained 51.3% of the total variation in generic composition, with 34.8% of the variation along the first axis (CA1) and 16.5% of the variation along the second axis (CA2). The canonical axes of the environmental variables and water mite assemblage were associated significantly with generic abundance (Pseudo F first axis = 10.9, p < 0.001; pseudo f all axis = 4.7, p >0.001) and generic composition (Pseudo F first axis = 7.2, p < 0.001; pseudo f all axis = 2.7, p >0.001).
Discussion
We found that several water mite taxa became increasingly dominant in streams with increased water quality and are likely sensitive to pollution, showing that water-mite assemblages can differentiate between attaining and agriculturally impaired streams. Specifically, abundance and composition of Monatractides and Ljania in streams appear to have been closely associated with greater IBI scores and Total Habitat Scores, indicating these taxa may be sensitive to pollution, since greater scores are often associated with higher water quality (Chalfant 2021b). In contrast, we also found several taxa became increasingly dominant in streams with reduced water quality, similar to known shifts expected from other bioindicator species. For example, the abundance and composition of Hygrobates, Sperchonopsis, and Mideopsis increased in impaired streams with lower water quality, indicating these taxa may be tolerant of polluted conditions. While drainage area did not significantly correlate with metrics of water mite assemblages, drainage area did appear to influence abundance of Sperchon, Atractides, and Feltria, indicating these genera may prefer larger order streams rather than smaller headwater streams.
While water mite abundance did not correlate with water quality metrics, diversity-based indices, such as water mite richness and Shannon Diversity, correlated with many of the biological and habitat metrics currently used to assess streams and rivers throughout Pennsylvania. Similar to benthic macroinvertebrate richness and diversity scores, water mite richness and Shannon Diversity increased at healthier sites and decreased at impaired sites. Similar findings have been reported globally (Gerecke and Schwoerbel 1991; Growns 2001; Miccoli et al. 2013; Goldschmidt et al. 2016).
Contrary to previous findings that found greater abundance in pristine streams (Growns 2001), we found that total abundance was not significantly different between attaining and impaired sites. This increase in abundance in our impaired sites can be explained by the consistent increase in abundance of a pollution-tolerant taxa, such as Hygrobates. In attaining streams, we found greater evenness of mite taxa; however, as water quality declined and the pollution-sensitive taxa became less dominant, Hygrobates abundance proportionally compensated for the decline in pollution-sensitive taxa. For example, in several impaired streams, Hygrobates accounted for more than 80% of all collected water mites, while in attaining streams, Hygrobates never comprised more than 34% of total water mites abundance. Moreover, Hygrobates appears to become vastly more abundant in polluted waters here in the USA, which is consistent with European studies that have found Hygrobates to be one of the most pollution-tolerant water mite taxa (Gerecke and Schwoerbel 1991; Smith et al. 2010; Goldschmidt 2016). Some Hygrobates species are especially tolerant of organic pollution, which is common within agriculturally impaired streams due to increased manure and fertilizer runoff from nearby pastures and cropland.
In addition to Hygrobates, we collected an unusually large number of Torrenticola at two impaired sites in southern Huntingdon County, where abundance exceeded 1,200 and 1,300 individuals and composed 73% and 54% of their respective water mite samples. This finding does not correspond with previous studies, which determined that Torrenticola is one of the more sensitive genera to pollution (Goldschmidt 2009; Fisher 2016). In addition to these two impaired sites, we documented Torrenticola at three additional impaired sites where their abundance was 1, 2, and 65 individuals, composing less than 13% of their respective samples. Across our attaining sites, Torrenticola were more common (10 out of 13 sites) and ranged in abundance (1–278 individuals) and sample composition (>1–68%). In a detailed examination of Torrenticola in Costa Rica, 28 of 42 Torrenticola species were restricted to heavily shaded, unpolluted sites, while the remaining 14 species were collected in streams affected by urban and agricultural runoff (Goldschmidt 2009). Three of these 14 species showed signs of high pollution tolerance, indicating that the species' capacity to tolerate pollution varies. Therefore, we hypothesize that if we identified Torrenticola (and perhaps other genera) to species, we would see different Torrenticola species inhabiting attaining and impaired streams.
While we showed differences between attaining and impaired streams, our study was limited to riffle-run microhabitats. Therefore, the water mite assemblages we characterized may not represent each stream's overall water mite diversity. For example, previous studies found differences between assemblages of water mites from riffle and stream edge habitats (Growns 2001) and riffle and leaf-litter habitats (Goldschmidt 2016). These studies found that stream edge habitats harbored the greatest abundance and diversity compared to riffle habitats (Growns 2001), and that water mite abundance and diversity were greater in riffles compared to leaf-litter (Goldschmidt 2016). Therefore, we likely overlooked additional taxa that may have been present outside the riffle-run habitats.
However, this oversight to sample multiple habitats does not alter the significance of our findings. Our water mite collection methods were modified from qualitative protocols (Smith et al. 2010) and incorporated PADEP macroinvertebrate sampling standardizations (Chalfant 2021a). These standardizations were derived from a seminal sampling approach (Barbour et al. 1999) in which the collector samples macroinvertebrates from the ''single, most productive habitat'' in a stream reach. In many cases, riffle-runs are considered the most productive habitat due to their stability, enriched oxygen levels, and lotic-erosional state, which increases substrate availability and diversity (e.g., gravel, cobble, boulder; Barbour et al. 1999). In high-gradient streams where cobble substrate is abundant, such as those sampled during this study, this sampling approach provides the most representative sample of the biological community as macroinvertebrate abundance and diversity tend to be highest in riffle-run habitats (Barbour et al. 1999).
While our results provide insights to the benefits of incorporating water mite diversity into biomonitoring strategies, future studies should address knowledge gaps in water mite taxonomy, distribution, and ecology. This can be accomplished by emphasizing water mite collections from additional lotic environments, including various stream types (e.g., coldwater vs. warmwater streams), stream sizes (e.g., headwater vs. larger streams and rivers), and stream habitats (e.g., riffle/run vs. pool/glide vs edge habitats). In addition, studies could also focus on unique ecological characteristics, such as family-, genus-, or species-level pollution tolerances. Most macroinvertebrates (e.g., Ephemeroptera, Plectoptera, Trichoptera) are identified to genus in water quality assessments, and most genera have their own unique pollution tolerance value. This value ranges from 0-10, with lower values indicating that a taxon is sensitive to water pollution, and higher values indicate a taxa's tolerance to high levels of water pollution. When utilizing benthic macroinvertebrates to assess water quality, these values play an important role in calculating index of biotic integrity (IBI) metrics (Chalfant 2021b). To better integrate water mites into these metrics, an understanding of their different pollution tolerances is necessary. By understanding which taxa are sensitive or tolerant to pollution or degraded environmental conditions, we may be able to successfully develop biological indices similar to those used for Pennsylvania's benthic macroinvertebrate assessments (Chalfant 2021b). This could be accomplished by sampling water mites from streams with various impairment sources (e.g., abandoned mine drainage, agriculture, urban runoff). Overall, this study shows that water mites can be used as a bioindicator species for water quality; however, further research is needed before biologists can fully incorporate water mites into standardized biomonitoring strategies.
Conclusion
Our research provided one of the first detailed examinations of Pennsylvania water mites, but it is also the first North American study to demonstrate that lotic water mites can be useful as bioindicators of water quality, with some genera showing more tolerance than others. Diversity indices, such as richness and Shannon Diversity, with water mites successfully differentiate between attaining and impaired streams and correlated with other metrics (e.g., Freestone IBI, Total Habitat Score) that quantify water quality. In addition, Hygrobates abundance increased in agriculturally impaired streams, indicating this genus likely has a greater tolerance to agricultural pollution than other water mite genera. Therefore, future water quality assessments in agriculturally influenced watersheds should examine water mite diversity and Hygrobates prevalence. The results that we presented here are comparable to previous studies of water mites as bioindicators from elsewhere in the world and will serve as a foundation for future North American studies of water mites and their associations with stream health.
Acknowledgement
We thank the Huntingdon County Conservation District for their technical assistance with landowner outreach and coordinating access to sample sites, Tim Charles Sr. for his assistance with field collection efforts, and J. Ray Fisher for his assistance in identifying water mites. This work was supported by the Sara Chinn Kalser Faculty Research Endowment through the Pennsylvania State University.
References
- Barbour M.T., Gerritsen J., Snyder B.D., Stribling J.B. 1999. Rapid bioassessment protocols for use in streams and wadeable rivers: periphyton, benthic macroinvertebrates and fish, Second Edition. United State Environmental Protection Agency (USEPA), Office of Water, Washington D.C.
- Bonada N., Prat N., Resh V.H., Statzner B. 2006. Developments in aquatic insect biomonitoring: a comparative analysis of recent approaches. Annual Review of Entomology, 51: 495-523. https://doi.org/10.1146/annurev.ento.51.110104.151124
- Chalfant B. 2021a. Wadable freestone riffle-run stream macroinvertebrate assessment method. Shull D. (Chapter Ed). In: Shull D., Whiteash R. (Eds). Assessment methodology for streams and rivers. Pennsylvania Department of Environmental Protection, Harrisburg, Pennsylvania.
- Chalfant B. 2021b. Wadeable riffle-run stream macroinvertebrate data collection protocol. Shull D. (Chapter Ed). In: Lookenbill J., Whiteash R. (Eds), Water quality monitoring protocols for streams and rivers. Pennsylvania Department of Environmental Protection, Harrisburg, Pennsylvania.
- Cicolani B., Miccoli F.P., Di Sabatino A., Giustini M., Lombardo P. 2009. The value of water mites (Hydrachnidia) as indicators of biodiversity and stream ecological status: an example from Abruzzo, central Italy. In A Cruise through Nice Waters - ASLO Aquatic Sciences Meeting, 25-30. Nice, France.
- Cîmpean M.D. 2010. Taxonomical and ecological study of water mite communities (Acari, Hydrachnidia) from the River Somežul Mic catchment area and their role as indicators of water quality. English summary of PhD Dissertation, Babež-Bolyai University, Cluj Napoca, Romania.
- Di Sabatino A., Gerecke R., Martin P. 2000. The biology and ecology of lotic water mites (Hydrachnidia). Freshwater Biology, 44: 47-62. https://doi.org/10.1046/j.1365-2427.2000.00591.x
- Di Sabatino A., Smit H., Gerecke R., Goldschmidt T., Matsumoto N., Cicolani B. 2008. Global diversity of water mites (Acari, Hydrachnidia, Arachnida) in freshwater. Hydrobiologica, 595: 303-315. https://doi.org/10.1007/s10750-007-9025-1
- Dodds W.K., Perkin J.S., Gerken J.E. 2013. Human impact on freshwater ecosystem services: a global perspective. Environmental Science & Technology, 47(16): 9061-9068. https://doi.org/10.1021/es4021052
- Fisher J.R. 2016. Integrative taxonomy of North American torrent mites (Parasitengona: Torrenticolidae: Torrenticola). Ph.D. dissertation, University of Arkansas.
- Fisher J.R., Fisher D.M., Skvarla M.J., Nelson W.A., Dowling A.P.G. 2017. Revision of torrent mites (Parasitengona, Torrenticolidae, Torrenticola) of the United State and Canada: 90 descriptions, molecular phylogenetics, and a key to species. Zookeys, 701: 1-496. https://doi.org/10.3897/zookeys.701.13261
- Gerecke R. 2002. The water mites (Acari, Hydrachnidia) of a little disturbed forest stream in southwest Germany - a study on seasonality and habitat preference, with remarks on diversity patterns in different geographical areas. In: Bernini F., Nannelli R., Nuzzaci G., de Lillo E. (Eds), Acarid Phylogeny and Evolution: Adaptation in Mites and Ticks, 69-89. Netherlands, Springer. https://doi.org/10.1007/978-94-017-0611-7_9
- Gerecke R., Schwoerbel J. 1991. Water quality and water mites (Acari, Actinedida) in the upper Danube region, 1959-1984. In: Dusbábek F., Bukva V. (Eds), Modern Acarology: Proceedings of the 8th International Congress of Acarology, 1: 483-491. The Hague, Prague and SPB Academic Publishing. Goldberg E.D., Hodge V., Griffin J., Gamble E., Bricker O.P., Matisoff G., Holdren G.R. 1978. A pollution history of Chesapeake Bay. Geochimica et Cosmochimica Acta, 42(9): 1413-1425 https://doi.org/10.1016/0016-7037(78)90047-9
- Goldschmidt T. 2009. The water mite genus Torrenticola (Hydrachnidia: Torrenticolidae) in Costa Rica-ecology, diversity, and bioindicator potential. In Sabelis, M.W., Bruin, J. (Eds.), Trends in Acarology, 185-191. https://doi.org/10.1007/978-90-481-9837-5_30
- Goldschmidt T. 2016. Water mites (Acari, Hydrachnidia): a powerful but widely neglected bioindicator - a review. Neotropical Biodiversity, 2: 12-25. https://doi.org/10.1080/23766808.2016.1144359
- Goldschmidt T., Helson J.E., Williams D.D. 2016. Ecology of water mites in Panama - first data on water mites (Acari, Hydrachnidia) as bioindicators in the assessment of biological integrity of neotropical streams. Limnologica, 59: 63-77. https://doi.org/10.1016/j.limno.2016.03.007
- Growns J.E. 2001. Aquatic mites as bioindicators, with an Australian example. In: Halliday R.B., Walter D.E., Proctor H.C., Norton R.A., Colloff M.J. (Eds), Acarology: Proceedings of the 10th International Congress, 136-142. Melbourne, CSIRO Publishing.
- Gurung M.M., Dorji C., Gurung D.B., Smit H. 2022. Environmental factors affecting water mites (Acari: Hydrachnidia) assemblage in streams, Mangde Chhu basin, central Bhutan. Journal of Threatened Taxa, 14(10): 21976-21991. https://doi.org/10.11609/jott.7979.14.10.21976-21991
- Kelderman K., Phillips A., Pelton T., Schaeffer E., MacGillis-Falcon P., Bernhardt C. 2022. The Clean Water Act at 50: Promises Half Kept at the Half-Century Mark. Environmental Integrity Project, 1-74. Washington D.C., USA.
- Kenney M.A., Sutton-Grier A.E., Smith R.F., Gresens S.E. 2009. Benthic macroinvertebrates as indicators of water quality: The intersection of science and policy. Terrestrial Arthropod Reviews, 2(2): 99 -128. https://doi.org/10.1163/187498209X12525675906077
- Kirchner J. W., Feng X., Neal C., Robson A. J. 2004. The fine structure of water‐quality dynamics: The (high‐frequency) wave of the future. Hydrological processes, 18(7), 1353-1359. https://doi.org/10.1002/hyp.5537
- Kirkhoff C.J., Simmons T.W., Hutchinson M. 2013. Adult mosquitoes parasitized by larval water mites in Pennsylvania. The Journal of Parasitology, 99 (1): 31-39. https://doi.org/10.1645/GE-3105.1
- Ko F.C., Baker J.E. 2004. Seasonal and annual loads of hydrophibic organic contaminants from the Susquehanna River basin to the Chesapeake Bay. Marine Pollution Bulletin, 48: 840-851. https://doi.org/10.1016/j.marpolbul.2003.10.014
- Lookenbill J., Whiteash R. (Eds). 2021. Water quality monitoring protocols for streams and rivers. Pennsylvania Department of Environmental Protection, Harrisburg, Pennsylvania.
- Manges A.B., Simmons T.W., Hutchinson M.L. 2018. First record of Aedes albopictus (Diptera: Culicidae) and second record of Aedes japonicus (Diptera: Culcidae) parasitized by water mites (Acari: Hydrachnidiae) in North America. Journal of Medical Entomology, 55(6): 1617-1621. https://doi.org/10.1093/jme/tjy105
- Metcalfe J.L. 1989. Biological water quality assessment of running waters based on macroinvertebrate communities: history and present status in Europe. Environmental Pollution, 60: 101-139. https://doi.org/10.1016/0269-7491(89)90223-6
- Meyer E.I. 1994. Species composition and seasonal dynamics of water mites (Hydracarina) in a mountain stream (Steina, Black Forest, southern Germany). Hydrobiologica, 288: 107-117. https://doi.org/10.1007/BF00007130
- Miccoli F.P., Lombardo P., Cicolani B. 2013. Indicator value of lotic water mites (Acari: Hydrachnidia) and their use in macroinvertebrate-based indices for water quality assessment purposes. Knowledge and Management of Aquatic Ecosystems, 411: 08. https://doi.org/10.1051/kmae/2013075
- O'Neill J.C., Fisher J.R., Nelson W.A., Skvarla M.J., Fisher D.M., Dowling A.P.G. 2016. Systematics of testudacarine torrent mites (Acari, Hydrachnidia, Torrenticolidae) with descriptions of 13 new species from North America. Zookeys, 582: 13-110.
- PADEP 2020. Pennsylvania Department of Environmental Protection (PADEP). 2020. 2020 Pennsylvania integrated water quality monitoring and assessment report. Pennsylvania Department of Environmental Protection, Harrisburg, Pennsylvania. https://gis.dep.pa.gov/IRStorymap2020/
- PADEP 2022. Pennsylvania Department of Environmental Protection (PADEP). 2022. 2022 Pennsylvania integrated water quality monitoring and assessment report. Pennsylvania Department of Environmental Protection, Harrisburg, Pennsylvania. https://storymaps.arcgis.com/stories/b9746eec807f48d99decd3a583eede12
- Peters N.E., Meybeck M. 2000. Water quality degradation effects on freshwater availability: impacts of human activities. Water International, 25(2): 185-193. https://doi.org/10.1080/02508060008686817
- Rosenberg D.M., Resh V. H. (Eds.). 1993. Freshwater biomonitoring and benthic macroinvertebrates. Chapman and Hall, New York.
- Shannon C.E. 1948. A mathematical theory of communication. Bell System Technical Journal, 27: 379-423 and 623-656. https://doi.org/10.1002/j.1538-7305.1948.tb00917.x
- Shaw T. 2021. Stream habitat data collection protocol. Lookenbill J. (Chapter Ed). In: Lookenbill J. and Whiteash R. (Eds), Water quality monitoring protocols for streams and rivers. Pennsylvania Department of Environmental Protection, Harrisburg, Pennsylvania.
- Shull D., Whiteash R., (Eds). 2021. Assessment methodology for streams and rivers. Pennsylvania Department of Environmental Protection, Harrisburg, Pennsylvania.
- Smit H. 2020. Water mites of the world with keys to the families, subfamilies, genera, and subgenera (Acari: Hydrachnidia). Monografieën van de Nederlandse Entomologische Vereniging, no. 12. 774 pp.
- Smith I.M, Cook D.R. 1999. North American species of Tartarothyas Viets (Acari: Hydrachnida: Hydryphantidae). International Journal of Acarology, 25(1): 37-42. https://doi.org/10.1080/01647959908683610
- Smith I.M., Cook D.R., Smith B.P. 2010. Water mites (Hydrachnidiae) and other arachnids. In: Thorp J., Covich A. (Eds). Ecology and Classification of North American Freshwater Invertebrates, 485-586. Massachusetts, Cambridge: Academic Press. https://doi.org/10.1016/B978-0-12-374855-3.00015-7
- Stenger L.R. 2023. Water mites as bioindicators of water quality conditions in Pennsylvania streams. Master of Science thesis, The Pennsylvania State University. https://etda.libraries.psu.edu/catalog/19192lrs5653
- Stenger L.R., Skvarla M.J. 2022. A quantitative method for collecting water mites in lotic, riffle-run habitats for water quality biomonitoring. Acarologia, 62(3): 621-636. https://doi.org/10.24349/05qz-joak
- Stribling J.B., Millard C.J., and Meals D.W. 2016. Biological monitoring of aquatic communities. In: Dressing S.A., Meals D.W., Harcum J.B., Spooner J., Stribling J.B., Richards R.P., Millard C.J., Lanberg S.A., O'Donnell J.G., Monitoring and evaluating nonpoint source watershed projects, 227-285. United States Environmental Protection Agency, Washington DC, U.S.A.
- Stroud Water Research Center. (2017). Model My Watershed [Software]. Available from https://wikiwatershed.org
- USGS 2022. United States Geological Survey (USGS). 2022. Locate your stream site by 12-digit HUC. Science in Your Watershed, 28 September 2022. https://water.usgs.gov/wsc/a_api/wbd/index_wbd.html
- Vasquez A.A., Kabalan B.C., Miller C.J. 2022. First data on water mite (Acari, Hydrachnidia) assemblages of Point Rosa Marsh, Harrison Township, Michigan, USA, and their use as environmental bioindicators of aquatic health. Acarologia, 62(3): 653-665. https://doi.org/10.24349/2m5p-c5ku
- Yasick A.L. Simmons T.W., Earle J.I. 2003. Parasitic mite larvae (Acari: Stygothrombidiidae) associated with stonefly adults (Insecta: Plecoptera) from an Allegheny mountain stream in western Pennsylvania, USA. In: Smith I.M. (Eds), An acarological tribute to David R. Cook (From Yankee Springs to Wheeny Creek), 323-330. Indira Publishing House, West Bloomfield, Michigan.
- Yoder C.O., Rankin E.T. 1998. The role of biological indicators in a state water quality management process. Environmental Monitoring and Assessment, 51(1): 61-88. https://doi.org/10.1023/A:1005937927108
- Zawal A., Stryjecki R., Stępień E., Buczyńska E., Buczyński P., Czachorowski S., Pakulnicka J., Śmietana P. 2017. The influence of environmental factors on water mite assemblages (Acari, Hydrachnidia) in a small lowland river: an analysis at different levels of organization of the environment. Limnology, 18(3): 333-343. https://doi.org/10.1007/s10201-016-0510-y
- Zhang G., Brady D.C., Ball W.P. 2013. Long-term seasonal trends of nitrogen, phosphorus, and suspended sediment load from the non-tidal Susquehanna River Basin to Chesapeake Bay. Science of the Total Environment, 452-453: 208-221. https://doi.org/10.1016/j.scitotenv.2013.02.012


2023-09-18
Date accepted:
2024-01-03
Date published:
2024-01-18
Edited by:
Mąkol, Joanna

This work is licensed under a Creative Commons Attribution 4.0 International License
2024 Stenger, Logan R.; Ferguson, Francesca M. and Skvarla, Michael
 Download article
Download the citation
RIS with abstract
(Zotero, Endnote, Reference Manager, ProCite, RefWorks, Mendeley)
RIS without abstract
BIB
(Zotero, BibTeX)
TXT
(PubMed, Txt)