


Development and testing of microsatellite loci for the study of population genetics of Ixodes ricinus Linnaeus, 1758 and Ixodes inopinatus Estrada-Peña, Nava & Petney, 2014 (Acari: Ixodidae) in the western Mediterranean region
Velez, Rita  1
; De Meeûs, Thierry
2
; Beati, Lorenza3
; Younsi, Hend4
; Zhioua, Elyes5
; Antunes, Sandra
6
; Domingos, Ana
7
; Ataíde Sampaio, Daniel8
; Carpinteiro, Dina9
; Moerbeck, Leonardo
10
; Estrada-Peña, Agustin
11
; Santos-Silva, Maria Margarida12
and Santos, Ana Sofia
13
1
; De Meeûs, Thierry
2
; Beati, Lorenza3
; Younsi, Hend4
; Zhioua, Elyes5
; Antunes, Sandra
6
; Domingos, Ana
7
; Ataíde Sampaio, Daniel8
; Carpinteiro, Dina9
; Moerbeck, Leonardo
10
; Estrada-Peña, Agustin
11
; Santos-Silva, Maria Margarida12
and Santos, Ana Sofia
13
1✉ Centro de Estudos de Vetores e Doenças Infeciosas Dr. Francisco Cambournac, Instituto Nacional de Saúde Doutor Ricardo Jorge (CEVDI-INSA), Águas de Moura, Portugal.
2Univ Montpellier, Cirad, IRD, Intertryp, Montpellier, France.
3The U.S. National Tick Collection, Institute for Coastal Plain Science, Georgia Southern University, Statesboro, GA, USA.
4Institut Supérieur des Sciences Biologiques Appliquées de Tunis (ISSBAT), Université Tunis El Manar, Tunis, Tunisia.
5Unit of Vector Ecology, Institut Pasteur de Tunis, Tunis, Tunisia.
6Global Health and Tropical Medicine, Instituto de Higiene e Medicina Tropical, Universidade Nova de Lisboa, Lisboa, Portugal.
7Global Health and Tropical Medicine, Instituto de Higiene e Medicina Tropical, Universidade Nova de Lisboa, Lisboa, Portugal.
8Unidade de Tecnologia e Inovação, Instituto Nacional de Saúde Doutor Ricardo Jorge (UTI), Lisboa, Portugal.
9Unidade de Tecnologia e Inovação, Instituto Nacional de Saúde Doutor Ricardo Jorge (UTI), Lisboa, Portugal.
10Global Health and Tropical Medicine, Instituto de Higiene e Medicina Tropical, Universidade Nova de Lisboa, Lisboa, Portugal.
11Department of Animal Pathology, Faculty of Veterinary Medicine, Zaragoza, Spain.
12Centro de Estudos de Vetores e Doenças Infeciosas Dr. Francisco Cambournac, Instituto Nacional de Saúde Doutor Ricardo Jorge (CEVDI-INSA), Águas de Moura, Portugal.
13✉ Centro de Estudos de Vetores e Doenças Infeciosas Dr. Francisco Cambournac, Instituto Nacional de Saúde Doutor Ricardo Jorge (CEVDI-INSA), Águas de Moura, Portugal & Instituto de Saúde Ambiental, Faculdade de Medicina, Universidade de Lisboa, Lisboa, Portugal.
2023 - Volume: 63 Issue: 2 pages: 356-372
https://doi.org/10.24349/bvem-4h49Original research
Keywords
Abstract
Introduction
Ixodes ricinus Linnaeus, 1758 (Acari: Ixodidae) is the most important arthropod vector of infectious agents of medical and veterinary concern in Europe. Some of these microorganisms include Borrelia burgdorferi Johnson et al. 1984 s.l., the agent of Lyme borreliosis, Anaplasma phagocytophilum Foggie, 1949, causing human and animal granulocytic anaplasmosis, Rickettsia helvetica Beati, Peter, Burgdorfer, Aeschliman & Raoult, 1993 and R. monacensis Simser et al. 2002, agents of spotted fever rickettsioses, Francisella tularensis McCoy & Chapin, 1912, causing tularemia, Babesia divergens M'Fadyean & Stockman, 1911 and B. microti França, 1912, responsible for babesiosis, Neoehrlichia mikurensis Kawahara et al. 2004, agent of human neoehrlichiosis, and a number of viruses responsible for encephalitis in humans and animals (tick-borne encephalitis virus, Louping ill virus or Tribec virus) (Rizzoli et al. 2014). This tick species is distributed throughout most of the European continent and North Africa, and its geographical range is expected to extend both in latitude and altitude as global temperatures rise (Medlock et al. 2013).
Evidence for genetic differentiation possibly explaining the observed plasticity of I. ricinus, a tick that can adapt to different geographic and ecological environments and to a diversity of vertebrate host species, has been addressed in previous studies, using different types of genetic markers, sampling methods and experimental designs. Results from these previous works revealed either the presence of genetic structure within Europe at a finer (Carpi et al. 2016) or wider geographic scales (Poli et al. 2020; Røed et al. 2016; Dinnis et al. 2014; Paulauskas et al. 2006), the presence of host-associated genetic differentiation (Kempf et al. 2011), an absence of population structure across Europe (Porretta et al. 2013; Noureddine et al. 2011; Casati et al. 2008; Delaye et al. 1997), or a clear genetic divergence between European and North African I. ricinus populations (Poli et al. 2020; Noureddine et al. 2011; De Meeûs et al. 2002). These earlier studies focused mostly on northern and central European tick communities, while no research has been conducted to understand the relationships between south-western European and North African I. ricinus populations.
Ixodes inopinatus Estrada-Peña, Nava & Petney 2014, a new species recently added to the I. ricinus complex, was first described from Spain, Portugal and North African countries (Estrada-Peña et al. 2014), and later presumably also in Central Europe (Chitimia-Dobler et al. 2018). Morphological differences between the two species are hard to ascertain with intermediate phenotypes often observed (Younsi et al. 2020). Otherwise, the identification of the two species has been based on mitochondrial gene sequencing. Mitochondrial genomes are known to be sometimes affected by introgression or incomplete lineage sorting events, causing discrepancies between mitochondrial and nuclear phylogenetic analyses (Backus et al. 2022; Patterson et al. 2017; Kovalev et al. 2015, 2016). These problems further emphasize the need for additional analyses of the genetic structure of this (or these) tick species.
Microsatellite markers have been used in several of the mentioned population genetics studies of I. ricinus, as well as in research on other arthropod vectors. Mutation rates of microsatellites are faster than either mitochondrial or nuclear genes, making them more informative at the population scale (Araya-Anchetta et al. 2015). A number of microsatellite loci have been described for I. ricinus (Noel et al. 2012; Røed et al. 2006; Delaye et al. 1998), but only a few of these have been tested in Mediterranean tick populations. Therefore, in this study, previously developed microsatellite markers were tested on Portuguese and Tunisian tick populations. In addition, and to enhance the power of our analyses, newly developed loci were tested. A characterization of the selected loci for both, Portuguese and Tunisian, subsamples is presented. Also, the results of a preliminary intercontinental genetic analysis performed with the most informative loci are described and discussed.
Materials and methods
Sampling and study sites
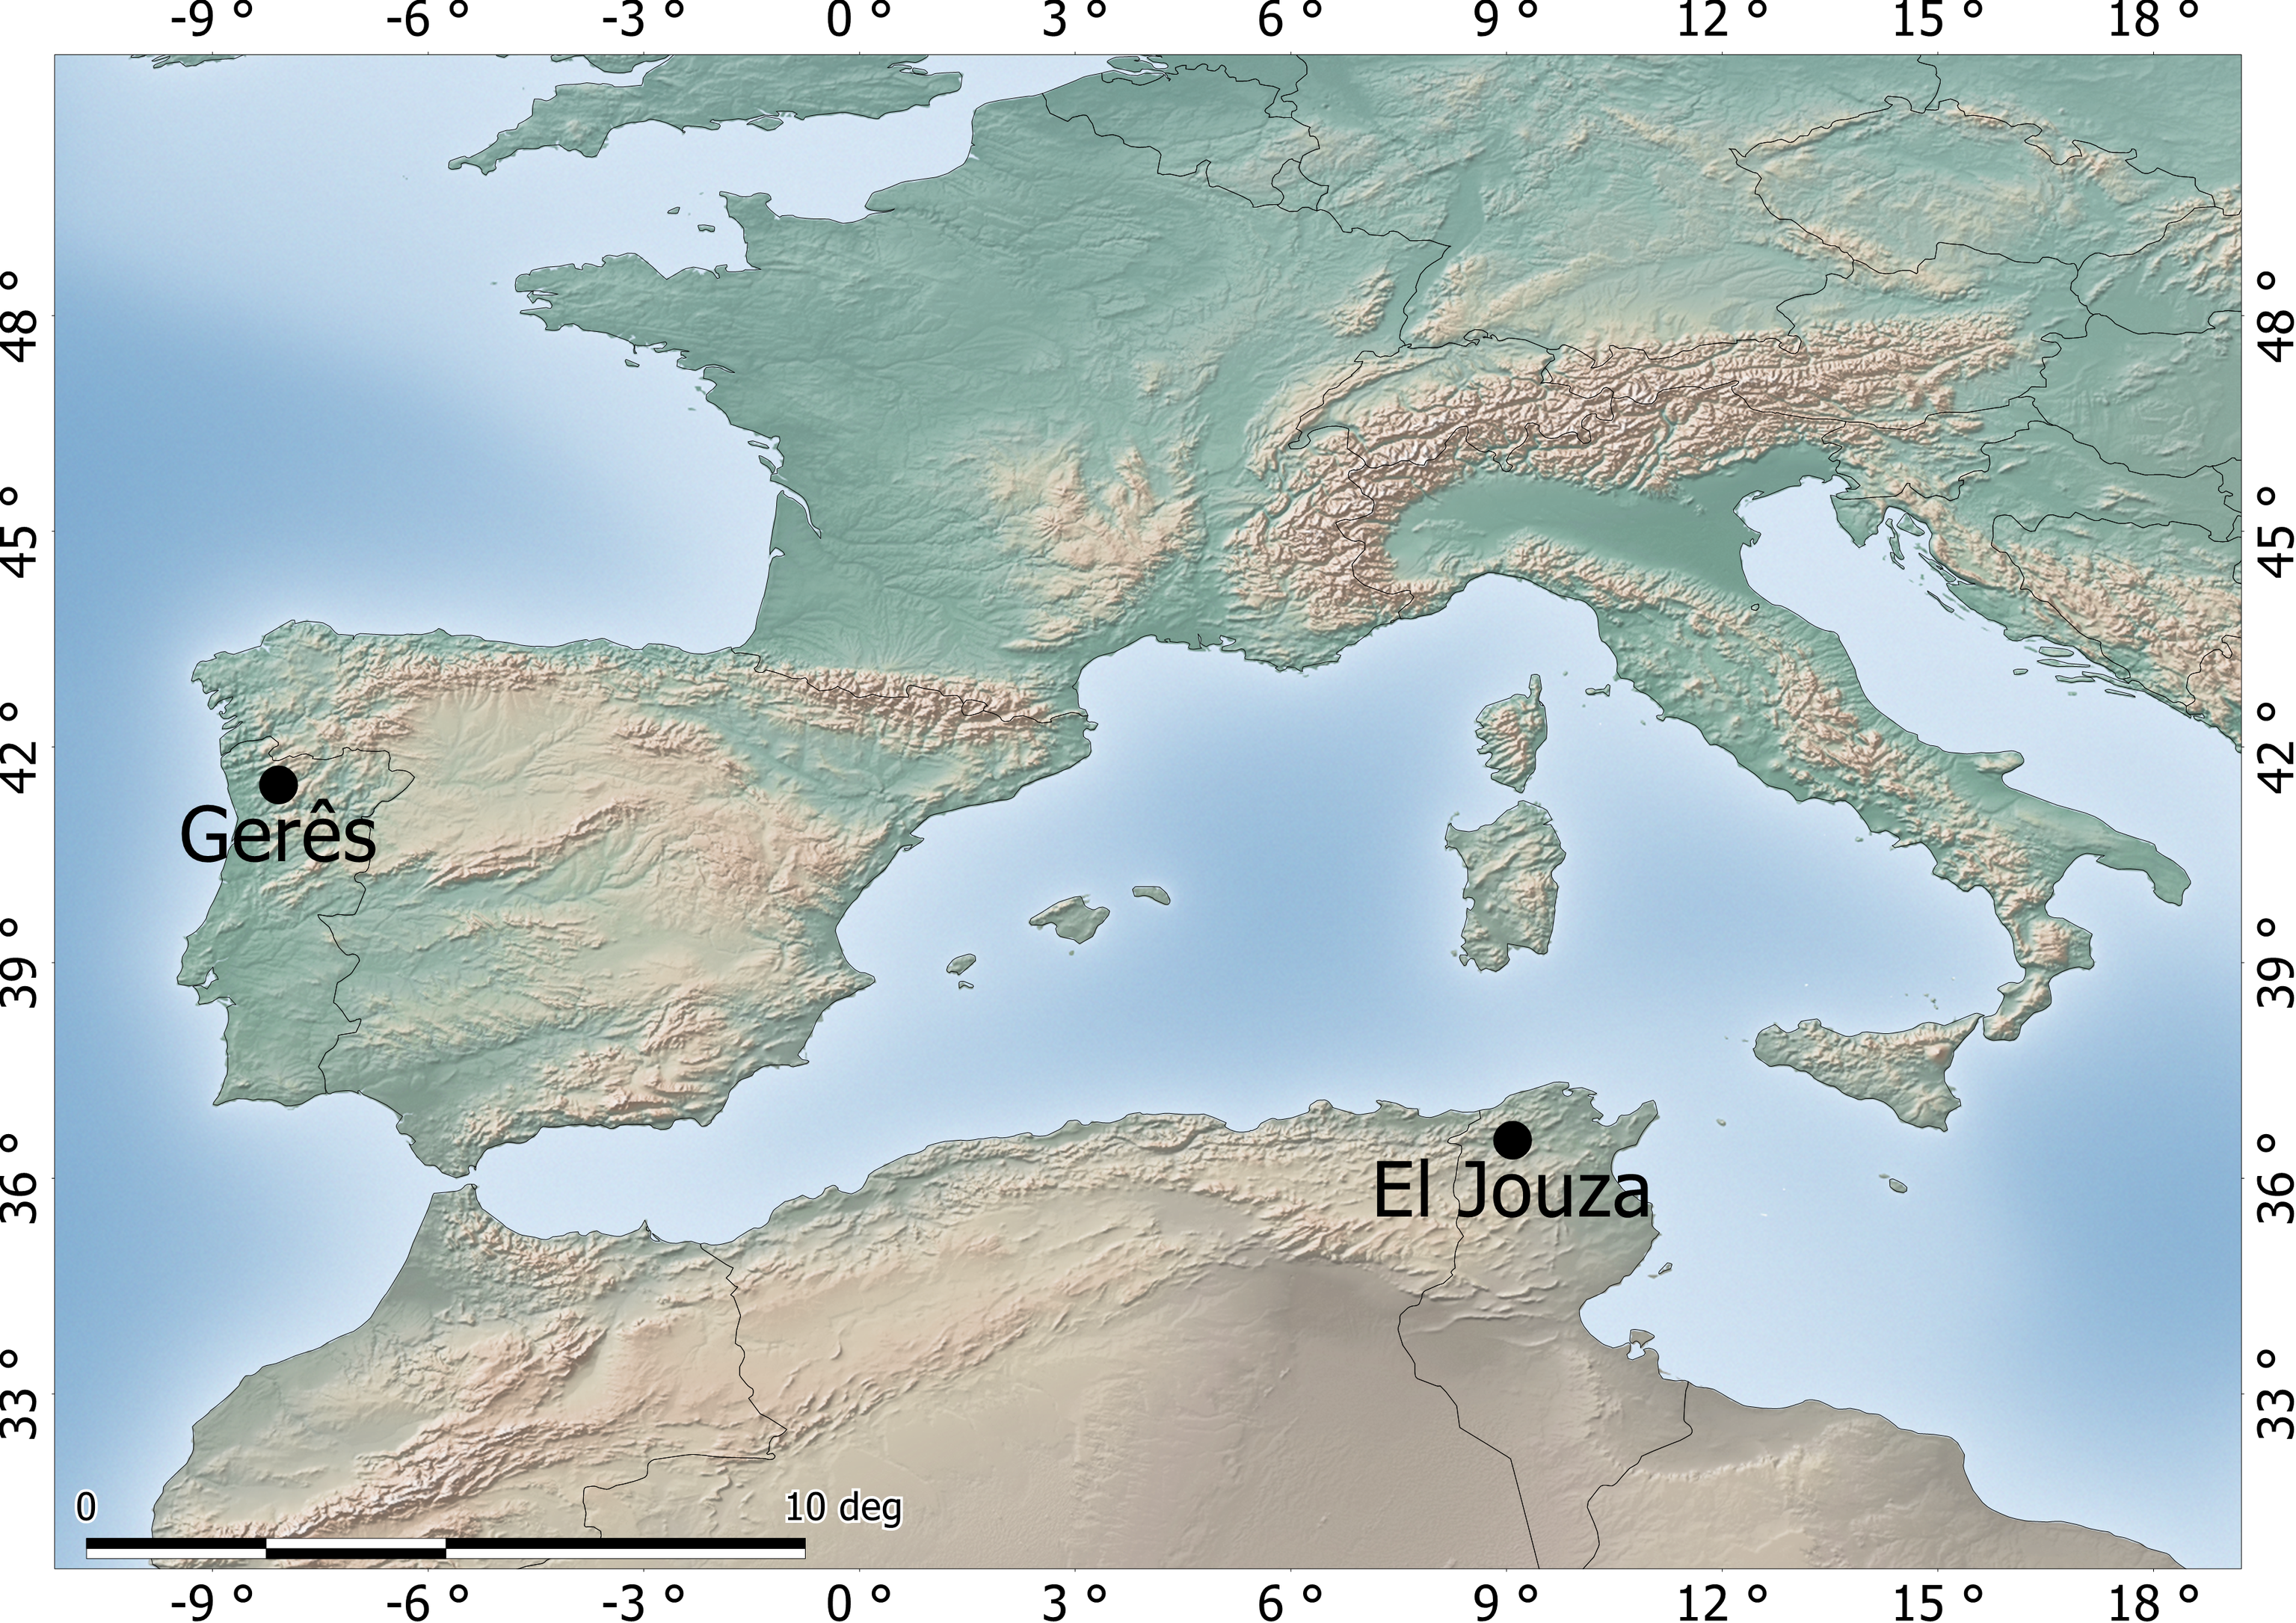
Tick collections were performed from February to May 2019 in two locations: Parque Natural da Peneda Gerês, north of Portugal (41°47′18.1″N 8°08′10.6″W) and El Jouza, Tunisia (36°52′9.88″N 009°0′8.42″E). Sampling locations are shown in Figure 1. Questing ticks were collected from the environment by dragging and/or flagging the vegetation. Collected specimens were submitted to a surface disinfection protocol consisting of submersion of live ticks in 20% bleach for 5 minutes, followed by submersion in 0.9% saline solution for 5 minutes. Individuals were preserved in 100% ethanol at 4 °C until DNA extraction. For the purpose of this study, only male ticks were used to allow an easier detection and exclusion of loci with potential X-linkage (in such case, a consistent homozygosity would be expected for males).
DNA extraction and 16S rRNA gene amplification
Ticks were examined morphologically and were processed for DNA extraction using a DNeasy Blood and Tissue kit (Qiagen N.V., Venlo, Netherlands), with some modifications to the manufacturer's protocol. A small incision was performed in the latero-posterior portion of the scutum or alloscutum, and ticks were incubated at 56 °C in 60 µL of Proteinase K at 14.3 mg/ml (Thermo Fisher Scientific, Waltham, Massachusetts, USA) and 180 µL ATL, until complete digestion of internal tissues. Volumes of other reagents of the kit were adjusted accordingly and washes with AW1 and AW2 buffers were doubled. DNA was eluted in 60 µL of molecular grade water at 72 °C, yield and purity were assessed by spectrophotometry (NanodropTM 1000, Thermo Scientific, Wilmington, NC, USA), followed by preservation at 4 °C until further use. A fragment of their 16S rRNA gene was amplified and sequenced by using 16S-F and 16-R primers (Mangold et al. 1997). GenBank accession numbers for the 16S rDNA sequences from Gerês (OP375366 - OP375385) and El Jouza (OP375386 - OP375405) are provided in supplementary table S1 for each tick.
Assessment of previously developed microsatellite loci
The amplification conditions for thirty-six previously described microsatellite markers (Delaye et al. 1998; Kempf et al. 2011; Noel et al. 2012; Røed et al. 2006; Van Houtte et al. 2013) were optimized for our samples. First, loci were individually amplified using a ''touch-down'' PCR programme with pooled tick DNA from five individuals from both study sites. PCR reactions consisted of 1x Type-it® Multiplex PCR Master Mix (Qiagen N.V., Venlo, Netherlands), 0.2 µM of each primer and approximately 100 ng of template DNA. Thermocycling conditions followed the protocol recommended by the Type-it kit, adapted to a ''touch-down'' programme, and consisted of 5 min denaturation at 95 °C; 7 cycles of 30 sec denaturation at 95 °C, 90 sec annealing at 64 °C with a decrease of 2 °C/cycle, 30 sec elongation at 72 °C; followed by 28 cycles of 30 sec denaturation at 95 °C, 90 sec annealing at 50 °C, 30 sec elongation at 72 °C, and a final extension at 68 °C for 10 min. New primer sets (mod) were designed for two loci showing amplification problems, IRN4 and IRN21 (Røed et al. 2006) using Primer3 version 4.1.0 (Koressaar and Remm 2007; Untergasser et al. 2012) with default settings; IRN4mod and IRN21mod primers are listed in Table 1.

For the twenty-nine loci showing successful DNA amplification, primer annealing temperatures (Ta) were further optimized, according to previously described locus-specific thermocycling conditions and primer melting temperatures (Tm). Loci described by Noel et al. (2012) were tested with the ''touch-down'' PCR protocol suggested by the authors, adapted to the Type-It kit specifications. This consisted of an initial 5 min denaturation step at 95 °C, followed by 16 cycles of 45 sec at 94 °C, 90 sec at 60 °C with this annealing temperature decreasing by 0.5 °C at each cycle, 30 sec at 72 °C, followed by 25 or 35 cycles of 45 sec at 94 °C, 90 sec at 52 °C, 30 sec at 72 °C, and a final extension step of 10 min at 68 °C. At this stage, pooled DNA, followed by individual DNA samples were used.
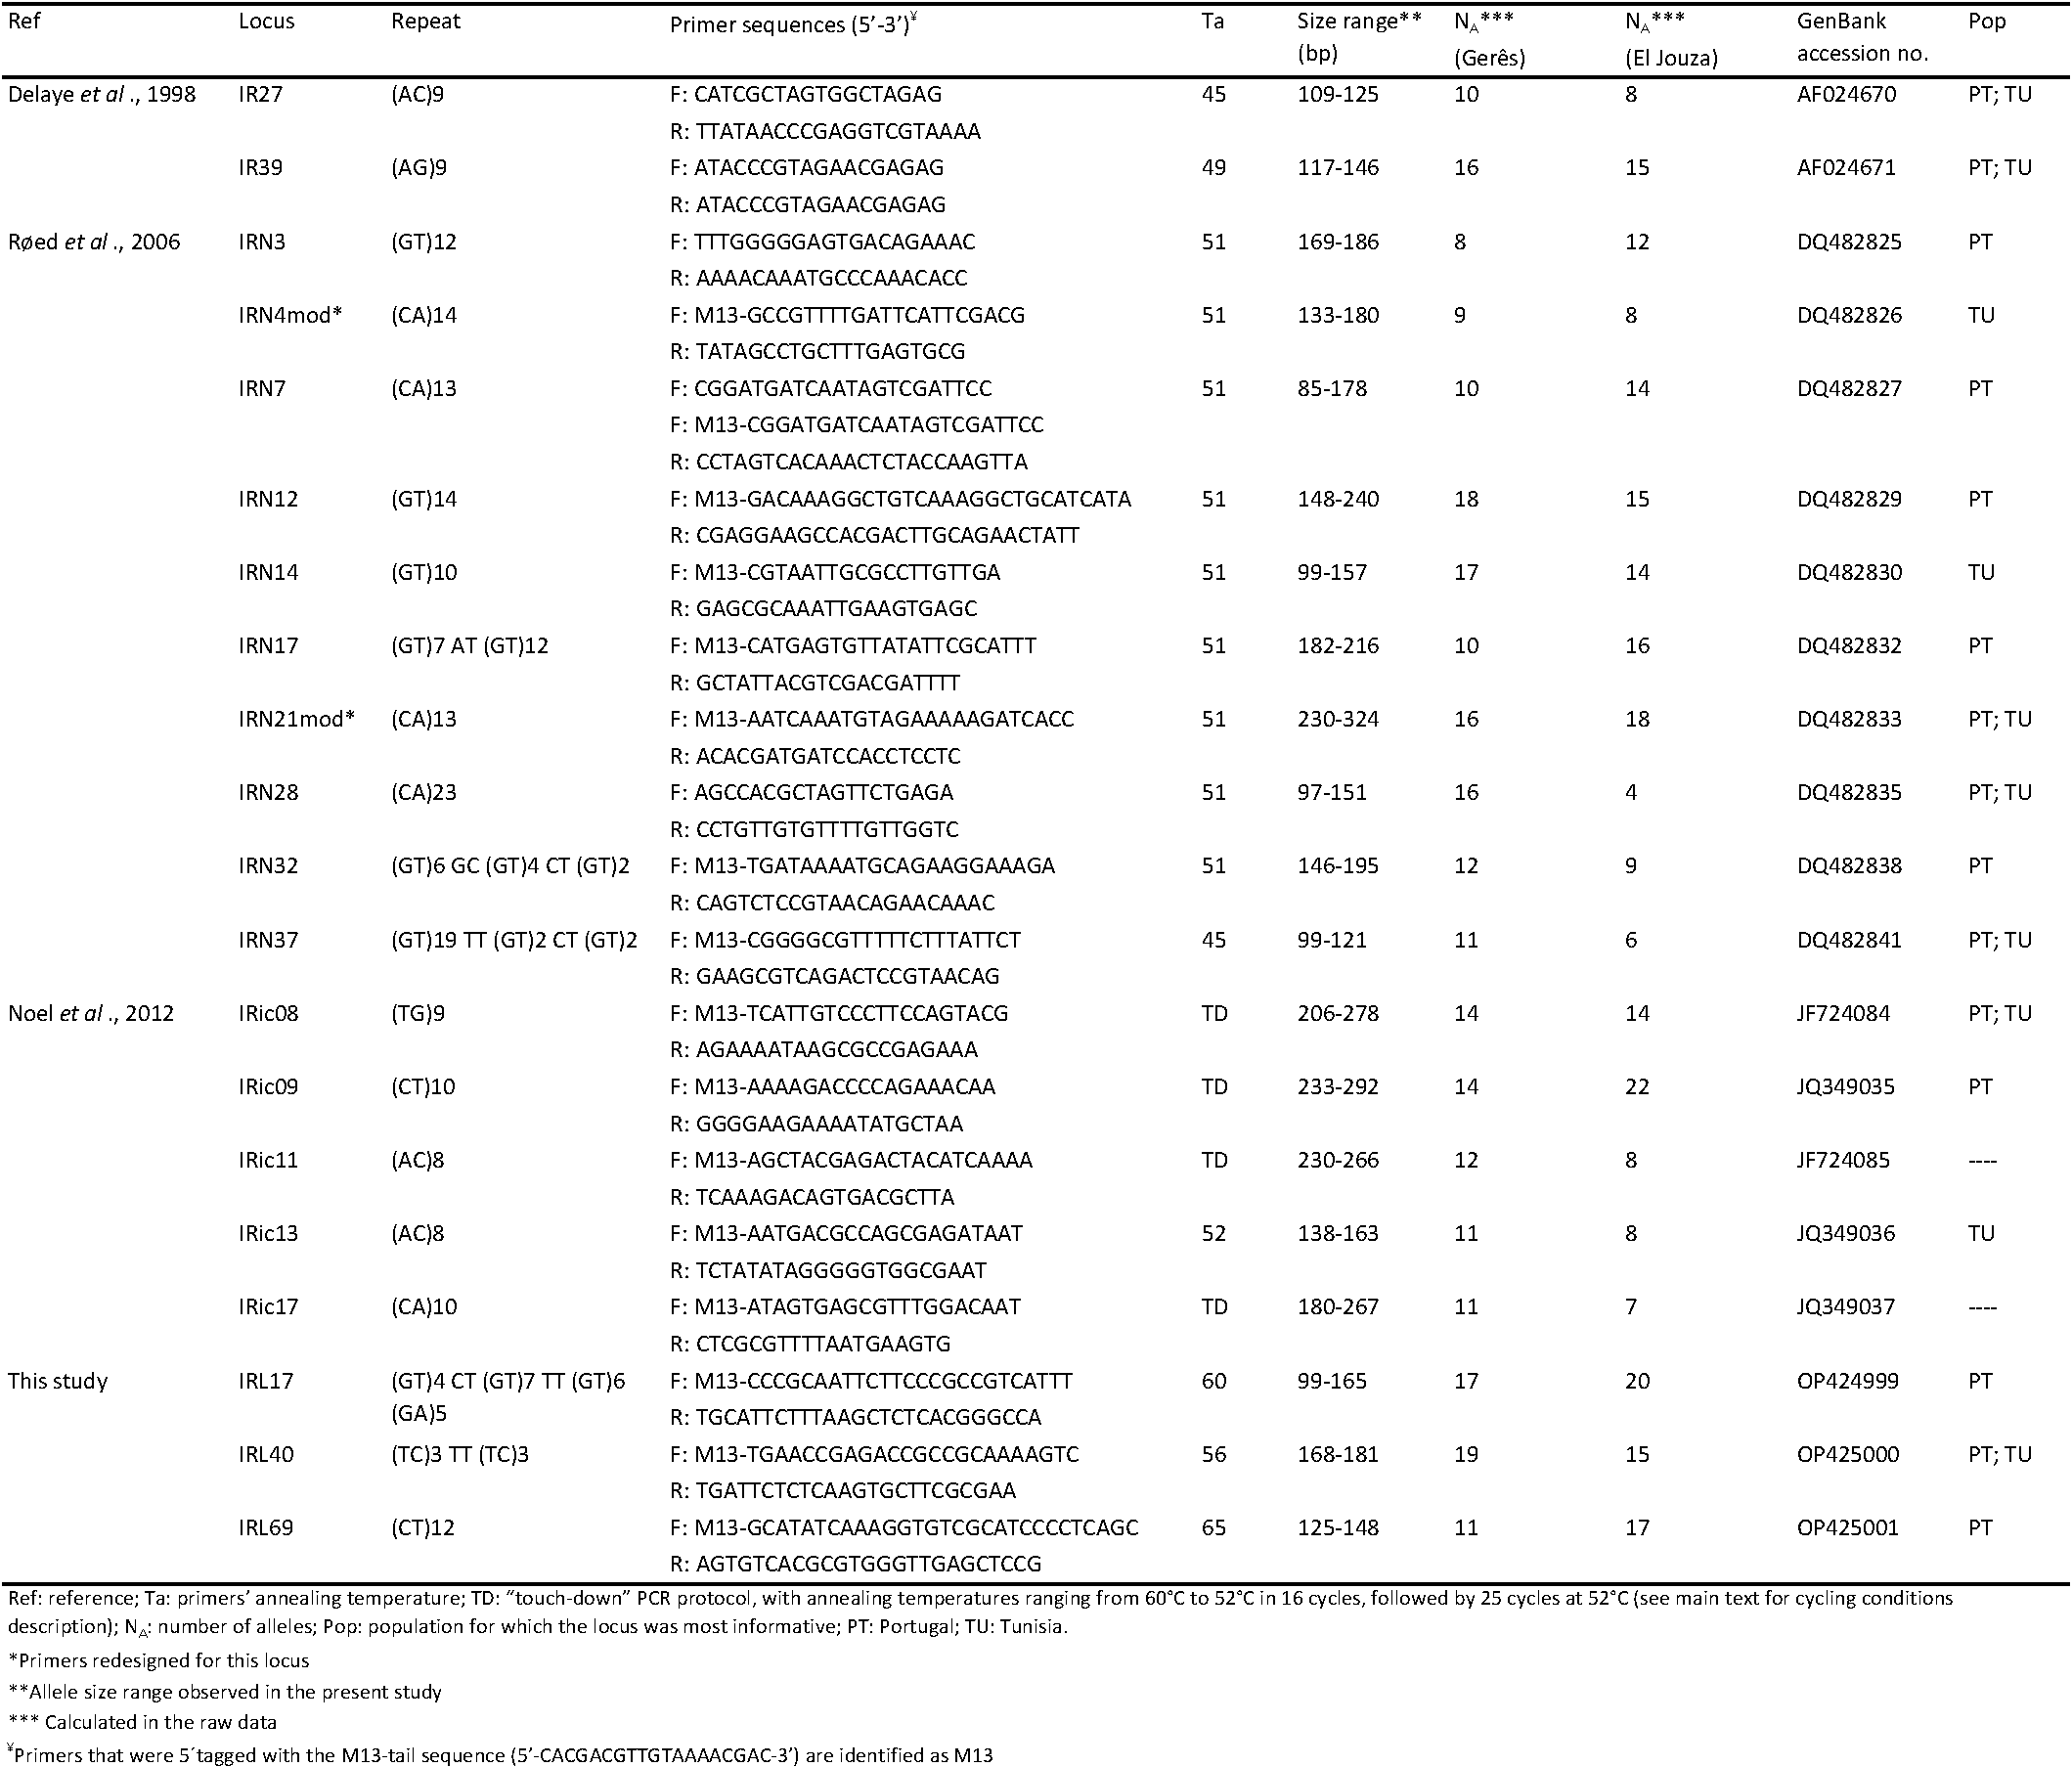
All primer pairs produced amplicons within the expected sizes and were used to genotype 40 tick DNA samples from both study locations (20 individuals each). For these PCR reactions, forward primers were either directly 5′-labelled with fluorophores (Applied Biosystems, Thermo Fisher ScientificTM, Waltham, MA, USA) or amplified with an M13-tail protocol (Table 1). IRN07 primers were labelled and ran using both approaches to confirm the consistency between protocols. For the former, PCR conditions were kept as described before, using 2 ng of template DNA in a total reaction volume of 10 µl, and changing the final extension step to 60 °C for 30 min. For the second protocol, each forward primer was 5′-tagged with an M13 tail (5′-CACGACGTTGTAAAACGAC-3′) and a 5′-fluorophore labelled M13 sequence was added to the reaction mix. Primer concentrations for the M13 protocol were adapted as follows: reverse primer and labelled tail were kept at 0.2 µM, while concentration of forward tailed primer was reduced to 0.05 µM (Culley et al. 2013). Thermocycling conditions were as described previously, but with 35 amplification cycles and a final extension step of 60 °C for 30 min. Samples failing to amplify under these protocols were re-amplified with higher template DNA concentration and/or number of PCR cycles. Fragments were read by capillary electrophoresis using a 3500 Genetic Analyser (Applied BiosystemsTM, Thermofisher Scientific, Waltham, MA, USA) and scored with GeneMarker® v.3.0.1 software (SoftGenetics® LCC, State College, USA). Fragment sizes were estimated by using the GenescanTM- 500 LIZTM size standard (Applied BiosystemsTM, Thermofisher Scientific, Waltham, MA, USA). Twelve loci were excluded due to difficulties in PCR conditions standardization and/or inconsistent results on fragment analysis. The remaining 17 microsatellite loci showed satisfactory amplification profiles and were kept for genetic analysis. Selected loci are described in Table 1.
Identification of new microsatellite loci and primer design
Genome sequences available under the Whole Genome Shotgun I. ricinus project (GenBank accession number JXMZ02000000) (Cramaro et al. 2015, 2017) were used to detect potentially amplifiable loci (PALs) with the Palfinder Galaxy Service (Griffiths et al. 2016), available at https://palfinder.ls.manchester.ac.uk/ ![]() . Pal_finder software, version 0.02.04.8 (Castoe et al. 2012) was used to find di-, tetra-, penta- and hexanucleotide repeat motifs, using default settings. Primers were designed with Primer3 and the following settings customised for use with the Type-it® Multiplex PCR kit (Qiagen): primer optimum length = 25 nucleotides (ranging from 18 to 30 nucleotides); minimum GC% content = 45%; maximum GC% content = 65%; optimum melting temperature = 68 °C (ranging from 62 °C to 75 °C).
. Pal_finder software, version 0.02.04.8 (Castoe et al. 2012) was used to find di-, tetra-, penta- and hexanucleotide repeat motifs, using default settings. Primers were designed with Primer3 and the following settings customised for use with the Type-it® Multiplex PCR kit (Qiagen): primer optimum length = 25 nucleotides (ranging from 18 to 30 nucleotides); minimum GC% content = 45%; maximum GC% content = 65%; optimum melting temperature = 68 °C (ranging from 62 °C to 75 °C).
This analysis retrieved 1405 dinucleotide PALs, from which any loci showing imperfect or interrupted motifs were excluded, as well as the ones with primers occurring more than once in the entire set of reads. From the 999 remaining PALs, 20 loci with a number of repeat motifs between 11 and 41 were selected for amplification testing (Van Asch et al. 2010). Finally, selected PALs' sequences were compared with previously described microsatellite markers to avoid duplications.
PALs were first tested with the ''touch-down'' protocol previously described and further optimized with a gradient PCR protocol (annealing temperatures set at 55 °C, 63 °C and 68 °C, according to primers' Tm range), using pooled and individual tick DNA samples from both sites in study. Loci showing satisfactory amplification profiles (single band at expected size on agarose gel) were sequenced to confirm the presence of the repeat patterns (Eurofins Genomics, Luxembourg). From these, 11 loci were M13-tagged and tested following the M13 protocol described above. Six primer pairs showing inconsistent amplification and two displaying consistent homozygosity (therefore suspected to be X-linked) were eliminated from the study. Three loci (IRL17, IRL40 and IRL69) were kept for the genetic analysis (Table 1).
Genetic distance between all individuals and neighbour-joining-tree
Microsatellite-based genetic distances were evaluated as the chord distances of Cavalli-Sforza and Edwards (Cavalli-Sforza and Edwards 1967) (DCSE). Because null alleles were known to occur (see results), the distance values for their presence were corrected by applying the INA method implemented in FreeNA, after missing data were recoded as homozygous for allele 999 (putative null homozygotes) (Chapuis and Estoup 2007). The DCSE matrix was used to build a neighbour-joining tree as recommended (Takezaki and Nei 1996) with MEGA 7.0.26 (Kumar et al. 2016).
Population genetics analyses
The raw data set was coded and converted into all required formats using Create (Coombs et al. 2008). Due to apparent discrepancies in the amplification success at several loci, Portuguese and Tunisian subsamples were initially analysed separately. The two subsamples were analysed together on a subset of loci working well in both sites. Methods used for population genetics data analyses were described in detail in previous papers (Manangwa et al. 2019; De Meeûs et al. 2021).
Population genetic structure was first evaluated through linkage disequilibrium (LD) tests and Wright's fixation indices (Wright 1965). To test for LD, we used the G-based test first described by Goudet et al. (1996) with 10000 permutations, as implemented within Fstat 2.9.4 (Goudet 2003). The Benjamini and Yekutieli (BY) False Discovery Rate (FDR) procedure (Benjamini and Yekutieli 2001) with R version 3.5.1 (R-Core-Team, 2020) was then used to account for repetition of correlated tests. To check if some loci were involved in a significant LD pair more often than by chance, as compared to the other loci, we also undertook a Fisher exact test with Rcmdr version 2.3.1 (Fox 2005, 2007).
F-statistics (FIS, FST and FIT) were estimated with Weir and Cockerham's unbiased estimators (Weir and Cockerham 1984) with Fstat. Significant departure from 0 of these F-statistics was tested with 10000 randomizations of alleles between individuals within a subsample (FIS; deviation from local random mating test) or of individuals between subsamples within the total sample (FST; population subdivision test). For FIS, the statistic used was f (Weir and Cockerham's FIS estimator). To test for subdivision, the G-based test (Goudet et al. 1996) over all loci was used, which is the most powerful procedure when combining tests across loci (De Meeûs et al. 2009).
To compute 95% confidence intervals (95% CI) of F‐statistics, we used the standard error of FIS (StrdErr FIS) and FST (StrdErr FST) computed by jackknife over populations, for each locus, or bootstrap over loci for the average across loci. More detailed explanations can be found elsewhere (De Meeûs et al. 2007).
In case of significant heterozygote deficits (characterized by significant departures from 0 of the F-statistics) and LD we tried to discriminate between sampling (Wahlund effect) and technical causes (null alleles, stuttering, short allele dominance (SAD), or allele dropouts) with the determination key proposed by De Meeûs (2018). The possible presence of null alleles was also investigated with MicroChecker v 2.2.3 (Van Oosterhout et al. 2004) and null allele frequencies estimated with Brookfield's second method (Brookfield 1996). The adjustment between observed and expected numbers of missing data was tested with a unilateral exact binomial test under R with the alternative hypothesis: ''there is not enough missing data as expected under panmixia''. MicroChecker also detects stuttering. Stuttering tests were obtained with exact binomial tests comparing observed and expected heterozygotes with one and two base differences computed graphically with MicroChecker. The presence of SAD was assessed with a regression FIS~ Allele size, weighted as described in De Meeûs et al. (2004), with a one-sided test (negative slope in case of SAD). To minimize SAD effects, all loci were double-checked by hunting micro-peaks at long alleles. We also attempted to cure loci with stuttering by pooling alleles close in size. Both methods are described in De Meeûs et al. (2021).
In dioecious species, heterozygote excesses are expected at all loci. Nevertheless, null alleles may display heterozygote deficits at affected loci. Default FIS test is one-sided in Fstat (heterozygote deficit). Two-sided –values were computed as twice the p-value, in case of heterozygote deficit, or twice 1-p-value otherwise.
A more accurate estimate of FST can be made for datasets with null alleles after recoding missing genotypes as homozygous for allele 999 (null allele) with the ENA method as implemented in FreeNA (Chapuis and Estoup 2007). RecodeData (Meirmans 2006) was used to obtain maximum divergence, and computed the maximum possible FST (FST_Max) with Fstat. This helped computing the normalized FST′ = FST/FST_max and the number of immigrants as Nm = (1- FST′)/(8FST) (assuming a two Island model of migration) (e.g. De Meeûs et al. 2007).
For the analysis with STRUCTURE version 2.3.4 (Pritchard et al. 2000), a burning period of 5,000, a number of MCMC replicates of 50,000, a number of clusters from 1 to 4 and default options were used, over all individuals with the admixture model and all the 20 loci. Each run was replicated 100 times. The results were then submitted to the method of Evanno et al. (2005) to determine the optimal number of clusters with STRUCTURE HARVESTER vA.2 (Earl and vonHoldt 2012).
Results
Morphological and 16S rDNA species determination
Ticks could not be identified morphologically based on Estrada-Peña et al. (2014) due to the presence of intermediate phenotypes. They were, therefore, identified through 16S rDNA sequencing which assigned all Portuguese ticks to I. ricinus sequence profiles (OP375366-OP375385), while the majority (n = 16) of the Tunisian ticks were identified as I. inopinatus sequence profiles (OP375386- OP375392, OP375396- OP375404) and four as I. ricinus (OP375393- OP375395, OP375405).
Results of the genotyping for the 20 loci (IR27, IR39, IRN3, IRN4mod, IRN7, IRN12, IRN14, IRN17, IRN21mod, IRN28, IRN32, IRN37, IRic08, IRic09, IRic11, IRic13, IRic17, IRL17, IRL40 and IRL69) are provided in the supplementary table S1.
Neighbour-joining-tree of all ticks with all loci
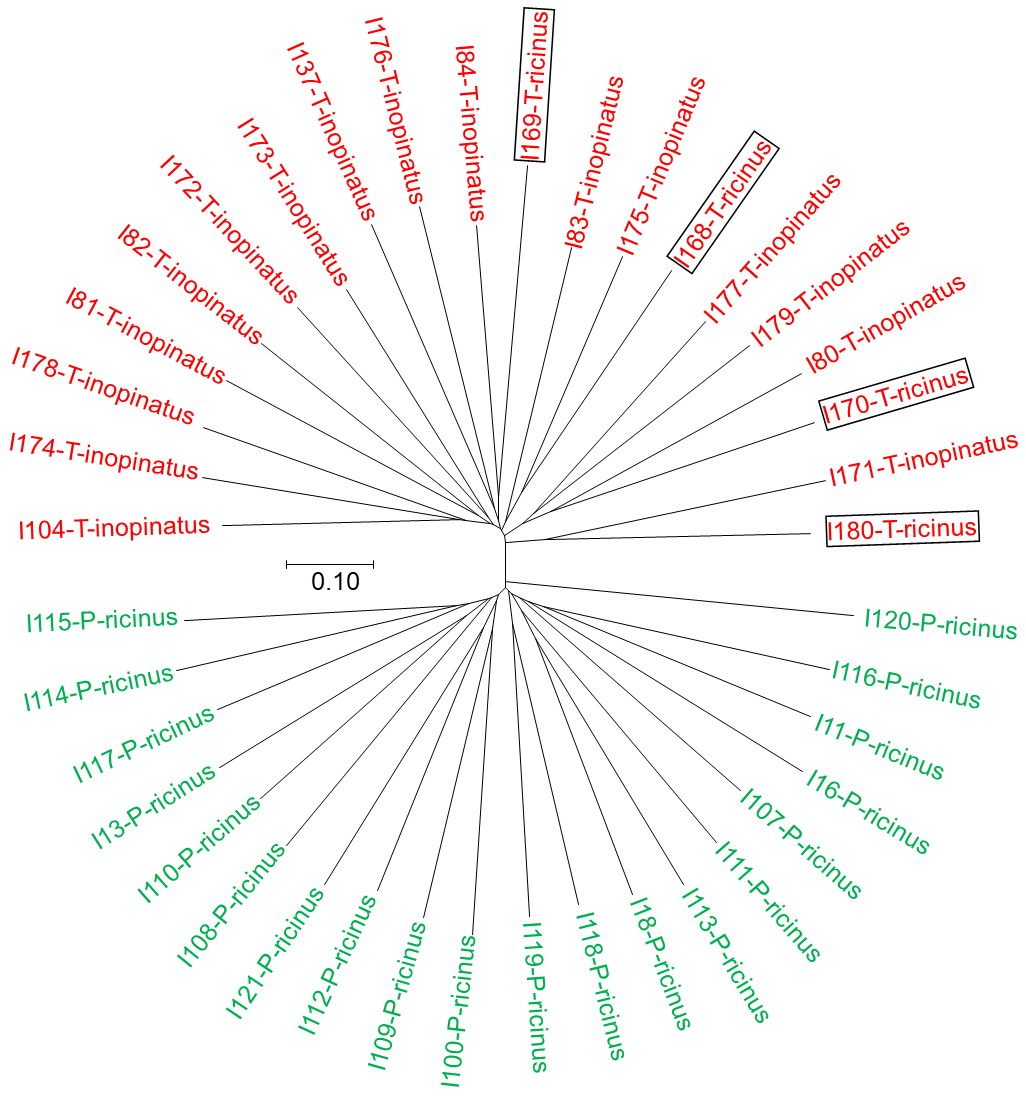
The neighbour-joining-tree based on 20 loci used for genotyping (Figure 2) revealed a split between Tunisian and Portuguese populations which consistently clustered in two separate clades. There is no indication that Tunisian ticks identified through 16S rDNA analysis either as I. inopinatus or I. ricinus differ in any significant way. Indeed, the Tunisian specimens identified as I. ricinus never clustered together but were all closer to individuals identified as I. inopinatus with the 16S sequence. Accordingly, without correction for null alleles, there was no subdivision between I. inopinatus and I. ricinus from Tunisia (FST = -0.0097), while subdivision between Tunisia and Portugal, ignoring 16S results, provided a highly significant subdivision: FST = 0.071, with 99% bootstrap confidence interval 99% CI = [0.039, 0.106].
Portuguese (Gerês) subsample raw data
Genetic diversity was high for all loci (HS\textgreater0.73). Linkage disequilibrium tests were then optimally powerful for each pair of loci. There were only five loci pairs in significant LD out of the 190 possible pairs (2.6%), and none stayed significant with the BY-FDR correction (p-values \textgreater0.22). Heterozygote deficits, if any, hardly could come from a Wahlund effect.
There was a highly significant and variable FIS = 0.264 in 95% CI = [0.174, 0.36] (two-sided p-value = 0.0002). Two missing data were observed at locus IRN4, which correlatively displayed the highest FIS = 0.804. Null alleles probably explain a large part of these heterozygote deficits, and this was confirmed by estimate of expected null homozygotes computed with Brookfield's second method with MicroChecker. According to this method, none of the observed number of missing data significantly deviated from those expected (all p-values \textgreater0.19). Nevertheless, the importance of FIS at several loci with very few or even no missing genotypes, suggested that other amplification problems (SAD, stuttering) were at stake.
SAD was tested on the 17 loci with a heterozygote deficit. Most p-values for SAD tests were below 0.5, and overall the 17 loci, with the generalized binomial procedure (Teriokhin et al. 2007; De Meeûs et al. 2009), the p-value was almost significant (p-value = 0.0575). This suggested a strong tendency for SAD across all loci, but at various degrees of intensity. Two loci displayed a significant SAD: IRN4 (p-value = 0.009), and IRic08 (p-value = 0.0286).
As for the results of the exact binomial tests performed for stuttering detection, most p-values were below 0.5, and the generalized binomial procedure revealed a significant p-value = 0.0033. Attempts of stuttering correction were undertook at all loci but those with a p-value \textgreater0.5. Pooling strategies are provided as supplementary material (Table S2).
Following the pooling of alleles, a drop of FIS was observed at several loci (IR27, IRN7, IRN17, IRN21, IRN32, IRic09, IRL17, and IRL40). In order to minimize SAD and stuttering effects, all loci with a FIS \textgreater0.3 (before and/or after correction) (IRN4, IRN14, IRic11, IRic13, and IRic17) were removed, kept loci for which stuttering correction improved FIS (smaller values; listed above), and also retained other loci unchanged (IR39, IRN3, IRN12, IRN28, IRN37, IRic08, and IRL69).
Portuguese (Gerês) subsample data corrected for stuttering and other problems
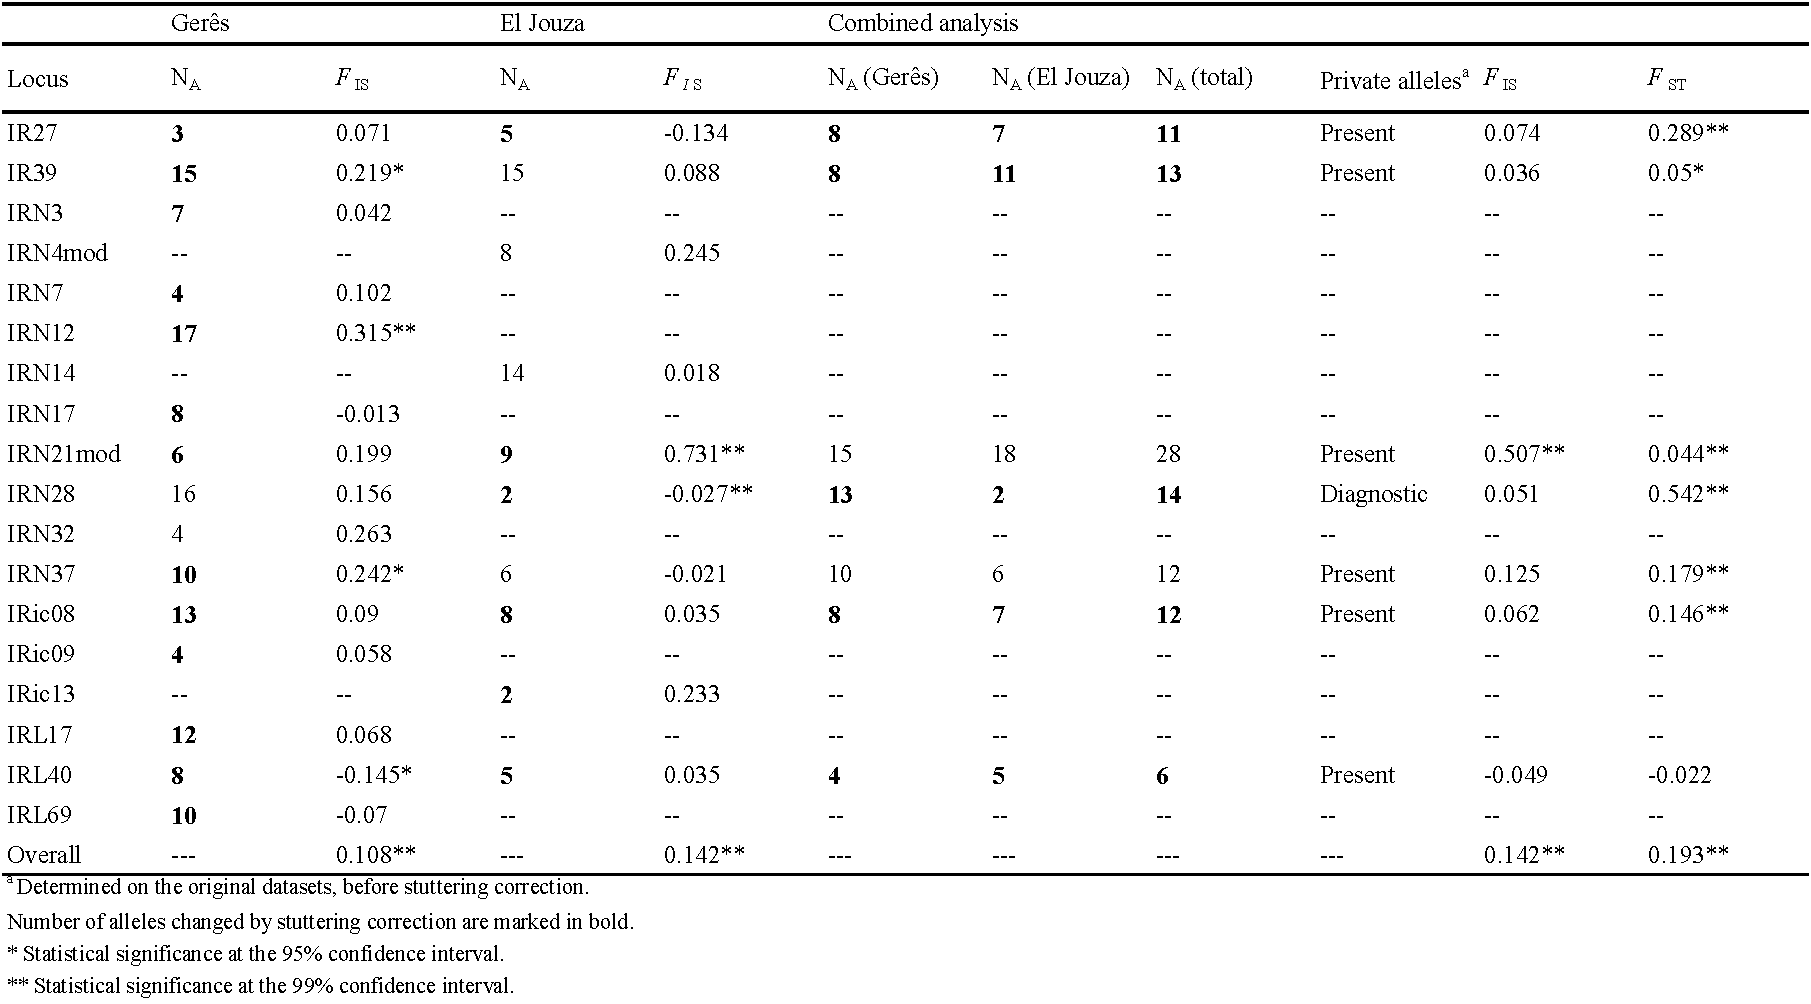
The proportion of locus pairs in significant LD did not change (3/105 = 2.9%). None of these tests stayed significant after BY correction (all p-values \textgreater0.38). There was still a highly significant and variable heterozygote deficit: FIS = 0.108 in 95% CI = [0.04, 0.174] (p-value \textless0.0002), probably mainly explained by null alleles, despite the absence of missing data. Some loci displayed negative FIS (null alleles at low frequencies, or even absent), as shown in Table 2. Overall, across all loci, no signature of SAD could be found (generalized binomial test result, p-value = 0.1101). Locus IRic08 was the only showing a significant FIS~ Allele size regression test (p-value = 0.029) but considering that its FIS was far from being the highest and could easily be explained by null alleles, SAD could confidently be excluded. Only LD based (Waples and Do 2008; Peel et al. 2013; Do et al. 2014), FIS based (Balloux 2004) and intra and inter loci correlations (Vitalis and Couvet 2001a, 2001b, 2001c) provided usable effective population sizes. These varied a lot with an average of Ne = 1051 in minimax = [78, 2226], suggesting a rather large effective population size.
Tunisian (El Jouza) subsample raw data
Six locus pairs (3.2%) appeared in significant LD. None of these tests stayed significant after BY correction (all p-values \textgreater0.82). There was a highly significant and variable FIS = 0.32 in 95% CI = [0.226, 0.42] (two-sided p-value \textless0.0002). Missing data (blanks) explained weakly the variation of FIS across loci (one-sided Spearman's rank correlation test ρ = 0.3645, p-value = 0.057, linear regression FIS~ blanks R2 = 0.2096). This is due to several loci with large FIS and no missing data. Nevertheless, observed missing data were well explained by expected ones according to Brookfield's second method (computed by MicroChecker) (ρ = 0.692, p-value = 0.0004, observed~ expected R² = 0.7195). No SAD test was significant (all p-values \textgreater0.16), and the generalized binomial procedure outputted a p-value = 0.6157. On the contrary, seven loci displayed a significant stuttering signature, and most loci displayed quite low p-values, which yielded a very low generalized binomial p-value = 0.0003. Stuttering correction attempts were then undertaken for all loci with a p-value \textless0.5 for stuttering, whenever possible.
Stutter corrections concerned 16 loci: IR27, IRN3, IRN7, IRN12, IRN14, IRN17, IRN21, IRN28, IRN32, IRic08, IRic11, IRic13, IRic17, IRL17, IRL40 and IRL69. These corrections are highlighted in allele pooling table S3, provided as supplementary material. It worked rather well for most loci, except for IRN14 and IRL17. Further analyses kept initial data for these two loci and kept stuttering corrections for the 14 other loci.
With this new dataset, eight locus pairs (4.2%) were in significant LD (improvement in power), and none stayed significant after BY correction (all p-values = 1). The heterozygote deficit was lower: FIS = 0.218 in 95% CI = [0.127, 0.32]. The number of missing genotypes per locus explained 44% of FIS variation (regression FIS~ number of blanks) (ρ = 0.61556, p-value = 0.0019). The intercept of this regression line (for no missing data, i.e. with a minimum of null alleles) stayed positive. This suggested that some loci were still affected by something else. We defined the upper bound of the 95% CI of the regression as ls95% = FIS_i -abs(FIS-ls), where FIS_i was the FIS at locus i, FIS was the average FIS and ls was the upper bound of the 95% CI of bootstraps over loci. When the loci that appeared over this upper bound (loci IRN3, IRN12, IRic11 and IRic17), i.e. with an excessive heterozygote deficit, were excluded the regression displayed a R² = 0.7268 and an intercept c = 0.0585. Finally, it was decided to exclude loci without missing data and an FIS \textgreater0.1, or a FIS \textgreater0.4 with only one missing data. The remaining 10 loci (IR27, IR39, IRN4, IRN14, IRN21, IRN28, IRN37, IRic08, IRic13 and IRL40) now displayed a R² = 0.8676 and c = -0.0063 (corresponding ρ = 0.61556, p-value = 0.002).
Tunisian (El Jouza) subsample with the 10 cleanest loci
Only one pair of loci (2.2%) displayed a significant LD (p-value = 0.0475, pBY = 1).
The heterozygote deficit decreased to FIS = 0.142 in 95% CI = [0.003, 0.337] (two-sided p-value = 0.0008) and is largely explained by null alleles. FIS results and number of alleles per locus for this subpopulation are described in Table 2.
Average effective population size was computed using the lower 95% CI in case of infinite Ne . Doing so, the average Ne = 129 in minimax = [28, 445] was substantially smaller than in Gerês.
Comparison between Portuguese and Tunisian subsamples
The FIS was not significantly different between the two sites (p-value = 0.2943, two-sided Wilcoxon sign rank test paired by locus). Nevertheless, there was an almost significant difference in the number of blanks between Portugal (0.5%) and Tunisia (2.25%) (p-value = 0.0636, two-sided Fisher exact test). This suggested more null alleles in Tunisia. In Portugal, three loci displayed a significant stuttering signature, against seven in Tunisia, which yielded a non-significant Fisher's exact test (p-value = 0.2733). For now, we may suspect that more SAD signatures were found in Gerês than in El Jouza, even if several of those were artificially produced by stuttering effects at smaller alleles, since it disappeared after stuttering correction. Locus IRN4 obviously strongly suffered from SAD in the Portuguese subsample and not in the Tunisian one. As far as null alleles and stuttering are concerned, it is probable that Tunisian ticks, due to their important genetic divergence with European ones (De Meeûs et al. 2002), experienced more amplification problems.
Genetic divergence between Gerês and El Jouza
This analysis was made with loci that were in common after locus selection in both sites. Seven loci remained: IR27, IR39, IRN21, IRN28, IRN37, Iric08 and IRL40. We directly tried to correct for stuttering and the result is shown in the allele pooling table S4, provided as supplementary material. Correction worked well for all loci but IRN21 and IRN37. Corrections were kept for the other five loci and kept IRN21 and IRN37 unchanged.
In this dataset, one locus pair displayed a significant LD in each site (not the same pair), and two globally. None stayed significant after BY correction.
There was a substantial and highly significant subdivision between the two subsamples (FST = 0.193 in 95% CI = [0.068, 0.334], p-value = 0.0001). Excess of polymorphism tend to lower FST values due to the effect of high mutation rates and number of allelic states in microsatellite loci (Hedrick 2005). Thus, FST estimate normalization was needed. No significant correlation was obtained between Nei's GST and HS (Nei and Chesser 1983) (ρ = -0.6071, p-value = 0.1768); however, it was considered that this result fitted with Wang's criterion (Wang 2015) for using the maximum possible FST (FST_max) to normalize FST. Because null alleles are present, the ENA correction was also used, and missing data were recoded as homozygous for allele 999, as recommended, and 5000 bootstraps over loci, with the software FreeNA (Chapuis and Estoup 2007) (FST_FreeNA). To obtain maximum divergence, and compute the maximum possible FST (FST_Max), RecodeData (Meirmans 2006) was used. The standardized value was then computed as FST_FreeNA′ = FST_FreeNA/FST_Max = 0.641 in 95% CI = [0.217, 1]. Assuming a two Islands model of migration, this led to an estimate of Nem = (1-FST_FreeNA′)/(8FST_FreeNA′) = 0.070 in 95% CI = [0, 0.450] immigrants exchanged per generation. This translated into two completely (or almost so) isolated populations.
Coming back to the raw data and all 20 loci, there were indeed private alleles in most loci, except for IRic13 and IRic17, for which frequent alleles (p ≥0.1) were never private. For IRN32, only rare alleles could be found in common and locus IRN28 was diagnostic between the two subsamples (no allele in common). Clade analysis in STRUCTURE estimated a maximum possible introgression of alleles from Portugal in Tunisia of less than 3%, and less than 2% for Tunisian alleles in Portugal. Average assignment to its population of origin was 0.9946 and 0.9949 for Tunisia and Portugal respectively. Minimum assignment of individuals was 0.9823 for individuals from Portugal and 0.971 for Tunisia. The detailed description of allele frequencies observed for each locus and population, as well as the results of the STRUCTURE analysis, can be found in supplementary tables S5 and S6.
Discussion
In this work, all microsatellite loci previously described for I. ricinus were tested with populations from Portugal and Tunisia. These included 31 loci specifically designed for I. ricinus (Delaye et al. 1998; Noel et al. 2012; Røed et al. 2006) and five loci developed for Ixodes arboricola showing promising cross-amplification with I. ricinus samples (Van Houtte et al. 2013). To the best of our knowledge, this was the first time that these microsatellite markers were used to genotype Portuguese I. ricinus populations, while only five of them had been previously applied to Tunisian samples (De Meeûs et al. 2002). From the initial 36 markers, only 17 presented consistent amplification profiles and were used in further genetic analyses. This clearly demonstrates that the development of microsatellite loci for a specific population does not always guarantee their applicability across the entire geographic range of the species and reinforces the need for preliminary testing of markers prior to studies targeting new tick populations. The difficulties encountered in our PCR optimization steps were early indicators of the substantial genetic differences occurring between the chosen populations of ticks.
In addition, new microsatellite markers were developed. These were designed from I. ricinus genome sequences available online and were tested and standardized with Mediterranean tick populations. From the 20 PALs initially selected for genotyping tests, three loci (IRL17, IRL40, IRL69) passed to the genetic analyses phase and were considered useful to be included in future studies. These newly developed markers are essential to complement the information provided by the previously described microsatellite loci, deemed insufficient to clearly characterize I. ricinus populations in the study area.
The 20 selected microsatellite loci behaved differently when tested with Portuguese or Tunisian ticks. This was already expected, as discrepancies in amplification success between populations at several loci had been previously detected during sample genotyping. Methods for minimizing the effects of SAD and stuttering described by De Meeûs et al. (2021) were applied with good results in this dataset. After double-checking the chromatograms of homozygous individuals for previously undetected micro-peaks, only two loci showed significant SAD in Gerês subpopulation, and none were found to be affected in El Jouza subsample. Stuttering was detected in both populations, but the use of pooling strategies adjusted to allele size differences, allele frequencies and FIS, improved heterozygosity estimates for eight (out of 17) and 14 (out of 16) loci in Gerês and El Jouza subpopulations, respectively. The same stuttering ''cure'' strategy also proved to be effective in the final analysis between the two land masses, improving FIS estimates for five (out of seven) loci.
The comparative study of both populations revealed a higher frequency of technical amplification problems (null alleles and stuttering) in El Jouza sample. This is in line with the fact that all loci available for I. ricinus were designed from European ticks, and supports the previously detected divergence between Tunisian and European I. ricinus populations (De Meeûs et al. 2002; Noureddine et al. 2011; Poli et al. 2020). Private alleles were detected in most loci, and a locus (IRN28) presented no allele in common, being considered diagnostic between the subsamples. Results from STRUCTURE suggest that if introgressed individuals existed in each of the subsamples, maximum introgression was less than 2% in Portugal and less than 3% in Tunisia. However, these values may easily come from the homoplasic nature of microsatellite loci (Jarne and Lagoda 1996), as suggested by the existence of several alleles and one complete locus (IRN28) that are diagnostic of the subsample of origin. The suggested genetic distance is also supported by the very low number of estimated immigrants exchanged per generation between both locations, resulting in two virtually isolated populations, which can correspond to two different species as was hypothesized by Poli et al. (2020). Even if ticks are easily transported from one continent to the other, this does not translate into efficient gene flow, raising the question of whether the Tunisian ticks are in fact I. inopinatus. This species was first described in Spain (type locality, La Pedriza, a locality not far from Madrid), Portugal, Algeria, Morocco and Tunisia (Estrada-Peña et al. 2014) and was observed living in sympatry with I. ricinus in Tunisia, namely in the El Jouza region (Younsi et al. 2020) and Central Europe (Chitimia-Dobler et al. 2018). Specimens identified as I. inopinatus from the Iberian Peninsula were all collected around or south of Madrid (Estrada-Peña et al. 2014). Unfortunately, none of the recent publications on population genetics of I. ricinus included ticks collected in the southern part of the Peninsula. Our samples of I. ricinus were also collected from the northern part of Portugal.
Therefore, based on preliminary data, it is possible to conclude that populations from northern Portugal and Tunisia are likely to belong to different species, as suggested by earlier studies. Indeed, microsatellite genotyping (De Meeûs et al. 2002), nuclear phylogenies (Noureddine et al. 2011), and SNP analyses (Poli et al. 2020) have already revealed the occurrence of a deep split between North African and European populations. In accordance with other authors, it was confirmed that adult I. inopinatus and I. ricinus cannot be differentiated by morphology (Younsi et al. 2020), but also not by 16S rRNA gene analysis, because all our Tunisian sample, which included both putative species, belonged to the same population when analysed with microsatellite markers.
Better diagnostic tools must be developed to positively identify I. inopinatus. In addition, I. inopinatus from the type locality and southern part of the Iberian Peninsula must be included in future population genetics studies, to determine whether they correspond to the separate taxonomic entity occurring in North Africa and Sicily. Based on the distribution of different genotypes of Borrelia lusitaniae (Norte et al. 2021), a known reptile-associated spirochete, it was hypothesized that the distribution range of the north-African population of ticks extends to the southern part of the Peninsula and is associated to a specific B. lusitaniae clade. As I. inopinatus is also considered to be a reptile-associated tick (Estrada-Peña et al. 2014), it is tempting to assume that the distribution of the tick and specific genotypes of B. lusitaniae are linked. Nevertheless, until factual data are provided, it should be noted that this reptile-associated spirochete has been known to travel, albeit sporadically, on ticks carried by birds (Wilhelmsson et al. 2020), which might result in the tick and the spirochete evolutionary histories to be uncoordinated as is the case in another Ixodes species (Humphrey et al. 2010). Therefore, further studies will be needed to taxonomically define I. ricinus populations belonging to this tick's south-western distribution range. Microsatellite markers sets defined in this study should be applied to larger tick samples, comprising additional locations across the Iberian Peninsula and the north of Africa. These results, together with interbreeding studies conducted between European and Tunisian tick populations, will add useful arguments to discuss the taxonomic status of the different units found among the I. ricinus s.l. entity.
Conclusion
In this work, we have revisited all microsatellite markers previously developed for I. ricinus and specifically tested them with Portuguese and Tunisian tick populations, to ascertain their suitability for this species' population genetics studies in the Mediterranean region. Additionally, new microsatellite loci have been developed to add to the currently available ones. Altogether, 15 suitable loci were identified for genetic analyses of Portuguese subpopulations, 10 loci for Tunisian ones, and seven informative loci to be used in inter-continental studies. A preliminary analysis of both datasets revealed two isolated populations, which are likely to correspond to two different species. The sets of microsatellite markers defined here can now be applied to larger-scale studies in the Mediterranean transition zone, hopefully contributing to define the population structure of I. ricinus s.l. across its geographic range and the taxonomic status of I. inopinatus. Interbreeding experiments, performed between European and Tunisian populations will also provide useful information to complement our understanding of the evolutionary genetics of I. ricinus populations.
Acknowledgements
This study was supported by FCT (Project TickGenoMi, reference PTDC/SAU-PAR/28947/2017).
Supplementary material
Supplementary Table S1 to S6 are provided as an excel file.
acarologia_4596_supplementary-tables.xlsx
References
- Araya-Anchetta A., Busch J.D., Scoles G.A., Wagner D.M. 2015. Thirty years of tick population genetics: A comprehensive review. Infect. Genet. Evol., 29: 164-179. https://doi.org/10.1016/j.meegid.2014.11.008
- Van Asch B., Pinheiro R., Pereira R., Alves C., Pereira V., Pereira F., Gusmão L., Amorim A. 2010. A framework for the development of STR genotyping in domestic animal species: Characterization and population study of 12 canine X-chromosome loci. Electrophoresis, 31(2): 303-308. https://doi.org/10.1002/elps.200900389
- Backus L.H., Foley J.E., Hobbs G.B., Bai Y., Beati L. 2022. A new species of tick, Ixodes (Ixodes) mojavensis (Acari: Ixodidae), from the Amargosa Valley of California. Ticks Tick. Borne. Dis., 13(6). https://doi.org/10.1016/j.ttbdis.2022.102020
- Balloux F. 2004. Heterozygote excess in small populations and the heterozygote-excess effective population size. Evolution (N. Y)., 58(9): 1891-1900. https://doi.org/10.1111/j.0014-3820.2004.tb00477.x
- Benjamini Y., Yekutieli D. 2001. The control of false discovery rate in multiple testing under dependency. Ann. Stat., 29(4): 1165-1188. https://doi.org/10.1214/aos/1013699998
- Brookfield J.F.Y. 1996. A simple new method for estimating null allele frequency from heterozygote deficiency. Mol. Ecol., 5(3): 453-455. https://doi.org/10.1111/j.1365-294X.1996.tb00336.x
- Carpi G., Kitchen A., Kim H.L., Ratan A., Drautz-Moses D.I., McGraw J.J., Kazimirova M., Rizzoli A., Schuster S.C. 2016. Mitogenomes reveal diversity of the European Lyme borreliosis vector Ixodes ricinus in Italy. Mol. Phylogenet. Evol., 101: 194-202. https://doi.org/10.1016/j.ympev.2016.05.009
- Casati S., Bernasconi M. V., Gern L., Piffaretti J.C. 2008. Assessment of intraspecific mtDNA variability of European Ixodes ricinus sensu stricto (Acari: Ixodidae). Infect. Genet. Evol., 8(2): 152-158. https://doi.org/10.1016/j.meegid.2007.11.007
- Castoe T.A., Poole A.W., de Koning A.P.J., Jones K.L., Tomback D.F., Oyler-McCance S.J., Fike J.A., Lance S.L., Streicher J.W., Smith E.N., Pollock D.D. 2012. Rapid microsatellite identification from illumina paired-end genomic sequencing in two birds and a snake. PLoS One, 7(2). https://doi.org/10.1371/journal.pone.0030953
- Cavalli-Sforza L.L., Edwards A.W.F. 1967. Phylogenetic analysis models and estimation procedures. Evolution. 21(3): 550-570. https://doi.org/10.1111/j.1558-5646.1967.tb03411.x
- Chapuis M.P., Estoup A. 2007. Microsatellite null alleles and estimation of population differentiation. Mol. Biol. Evol., 24(3): 621-631. https://doi.org/10.1093/molbev/msl191
- Chitimia-Dobler L., Rieß R., Kahl O., Wölfel S., Dobler G., Nava S., Estrada-Peña A. 2018. Ixodes inopinatus − Occurring also outside the Mediterranean region. Ticks Tick. Borne. Dis., 9(2): 196-200. https://doi.org/10.1016/j.ttbdis.2017.09.004
- Coombs J.A., Letcher B.H., Nislow K.H. 2008. Create: A software to create input files from diploid genotypic data for 52 genetic software programs. Mol. Ecol. Resour., 8(3): 578-580. https://doi.org/10.1111/j.1471-8286.2007.02036.x
- Cramaro W.J., Hunewald O.E., Bell-Sakyi L., Muller C.P. 2017. Genome scaffolding and annotation for the pathogen vector Ixodes ricinus by ultra-long single molecule sequencing. Parasites Vectors, 10(1): 1-9. https://doi.org/10.1186/s13071-017-2008-9
- Cramaro W.J., Revets D., Hunewald O.E., Sinner R., Reye A.L., Muller C.P. 2015. Integration of Ixodes ricinus genome sequencing with transcriptome and proteome annotation of the naïve midgut. BMC Genom., 16(1): 1-15. https://doi.org/10.1186/s12864-015-1981-7
- Culley T.M., Stamper T.I., Stokes R.L., Brzyski J.R., Hardiman N.A., Klooster M.R., Merritt B.J. 2013. An efficient technique for primer development and application that integrates fluorescent labeling and multiplex PCR. Appl. Plant Sci., 1(10): 1300027. https://doi.org/10.3732/apps.1300027
- Delaye C., Aeschlimann A., Renaud F., Rosenthal B., De Meeûs T. 1998. Isolation and characterization of microsatellite markers in the Ixodes ricinus complex (Acari: Ixodidae). Mol. Ecol., 7(3): 360-361. https://doi.org/10.1046/j.1365-294X.1998.00306.x
- Delaye C., Beati L., Aeschlimann A., Renaud F., De Meeûs T. 1997. Population genetic structure of Ixodes ricinus in Switzerland from allozymic data: no evidence of divergence between nearby sites. Int. J. Parasitol., 27(7): 769-72. https://doi.org/10.1016/S0020-7519(97)00040-4
- Dinnis R.E., Seelig F., Bormane A., Donaghy M., Vollmer S.A., Feil E.J., Kurtenbach K., Margos G. 2014. Multilocus sequence typing using mitochondrial genes (mtMLST) reveals geographic population structure of Ixodes ricinus ticks. Ticks Tick. Borne. Dis., 5(2): 152-160. https://doi.org/10.1016/j.ttbdis.2013.10.001
- Do C., Waples R.S., Peel D., Macbeth G.M., Tillett B.J., Ovenden J.R. 2014. NeEstimator v2: Re-implementation of software for the estimation of contemporary effective population size (Ne) from genetic data. Mol. Ecol. Resour., 14(1): 209-214. https://doi.org/10.1111/1755-0998.12157
- Earl D.A., vonHoldt B.M. 2012. STRUCTURE HARVESTER: A website and program for visualizing STRUCTURE output and implementing the Evanno method. Conserv. Genet. Resour., 4(2): 359-361. https://doi.org/10.1007/s12686-011-9548-7
- Estrada-Peña A., Nava S., Petney T. 2014. Description of all the stages of Ixodes inopinatus n. sp. (Acari: Ixodidae). Ticks Tick. Borne. Dis., 5(6): 734-743. https://doi.org/10.1016/j.ttbdis.2014.05.003
- Evanno G., Regnaut S., Goudet J. 2005. Detecting the number of clusters of individuals using the software STRUCTURE: A simulation study. Mol. Ecol., 14(8): 2611-2620. https://doi.org/10.1111/j.1365-294X.2005.02553.x
- Fox J. 2005. The R Commander: a basic-statistics graphical user interface to R. J. Stat. Softw., 14(9): 1-42.
- Fox J. 2007. Extending the R Commander by ′Plug-In′ packages.pdf. R News, 7(3): 46-52.
- Goudet J. 2003. FSTAT (version 2.9.4), a program (for Windows 95 and above) to estimate and test population genetics parameters. Department of Ecology & Evolution, Lausanne University, Switzerland, 53.
- Goudet J., Raymond M., De Meeûs T., Rousset F. 1996. Testing differentiation in diploid populations. Genetics, 144(4): 1933-1940. https://doi.org/10.1093/genetics/144.4.1933
- Griffiths S.M., Fox G., Briggs P.J., Donaldson I.J., Hood S., Richardson P., Leaver G.W., Truelove N.K., Preziosi R.F. 2016. A Galaxy-based bioinformatics pipeline for optimised, streamlined microsatellite development from Illumina next-generation sequencing data. Conserv. Genet. Resour., 8(4): 481-486. https://doi.org/10.1007/s12686-016-0570-7
- Hedrick P.W. 2005. A standardized genetic differentiation measure. Evolution (N. Y)., 59(8): 1633-1638. https://doi.org/10.1111/j.0014-3820.2005.tb01814.x
- Van Houtte N., Van Oosten A.R., Jordaens K., Matthysen E., Backeljau T., Heylen D.J.A. 2013. Isolation and characterization of ten polymorphic microsatellite loci in Ixodes arboricola, and cross-amplification in three other Ixodes species. Exp. Appl. Acarol., 61(3): 327-336. https://doi.org/10.1007/s10493-013-9702-x
- Humphrey P.T., Caporale D.A., Brisson D. 2010. Uncoordinated phylogeography of Borrelia burgdorferi and its tick vector, Ixodes scapularis. Evolution (N. Y)., 64(9): 2653-2663. https://doi.org/10.1111/j.1558-5646.2010.01001.x
- Jarne P., Lagoda P.J.L. 1996. Microsatellites, from molecules to populations and back. Trends Ecol. Evol., 11(10): 424-429. https://doi.org/10.1016/0169-5347(96)10049-5
- Kempf F., De Meeûs T., Vaumourin E., Noel V., Taragel′ová V., Plantard O., Heylen D.J.A., Eraud C., Chevillon C., McCoy K.D. 2011. Host races in Ixodes ricinus, the European vector of Lyme borreliosis. Infect. Genet. Evol., 11(8): 2043-2048. https://doi.org/10.1016/j.meegid.2011.09.016
- Koressaar T., Remm M. 2007. Enhancements and modifications of primer design program Primer3. Bioinformatics, 23(10): 1289-1291. https://doi.org/10.1093/bioinformatics/btm091
- Kovalev S.Y., Golovljova I. V., Mukhacheva T.A. 2016. Natural hybridization between Ixodes ricinus and Ixodes persulcatus ticks evidenced by molecular genetics methods. Ticks Tick. Borne. Dis., 7(1): 113-118. https://doi.org/10.1016/j.ttbdis.2015.09.005
- Kovalev S.Y., Mikhaylishcheva M.S., Mukhacheva T.A. 2015. Natural hybridization of the ticks Ixodes persulcatus and Ixodes pavlovskyi in their sympatric populations in Western Siberia. Infect. Genet. Evol., 32: 388-395. https://doi.org/10.1016/j.meegid.2015.04.003
- Kumar S., Stecher G., Tamura K. 2016. MEGA7: Molecular Evolutionary Genetics Analysis Version 7.0 for bigger datasets. Mol. Biol. Evol., 33(7): 1870-1874. https://doi.org/10.1093/molbev/msw054
- Manangwa O., De Meeûs T., Grébaut P., Ségard A., Byamungu M., Ravel S. 2019. Detecting Wahlund effects together with amplification problems: Cryptic species, null alleles and short allele dominance in Glossina pallidipes populations from Tanzania. Mol. Ecol. Resour., 19(3): 757-772. https://doi.org/10.1111/1755-0998.12989
- Mangold A.J., Bargues M.D., Mas-Coma S. 1997. 18S rRNA gene sequences and phylogenetic relationships of European hard-tick species (Acari: Ixodidae). Parasitol. Res., 84(1): 31-37. https://doi.org/10.1007/s004360050352
- Medlock J.M., Hansford K.M., Bormane A., Derdakova M., Estrada-Peña A., George J.C., Golovljova I., Jaenson T.G.T., Jensen J.K., Jensen P.M., Kazimirova M., Oteo J.A., Papa A., Pfister K., Plantard O., Randolph S.E., Rizzoli A., Santos-Silva M.M., Sprong H., Vial L., Hendrickx G., Zeller H., Van Bortel W. 2013. Driving forces for changes in geographical distribution of Ixodes ricinus ticks in Europe. Parasites Vectors, 6(1): 1-11. https://doi.org/10.1186/1756-3305-6-1
- De Meeûs T. 2018. Revisiting FIS, FST, Wahlund effects, and null alleles. J. Hered., 109(4): 446-456. https://doi.org/10.1093/jhered/esx106
- De Meeûs T., Beati L., Delaye C., Aeschlimann A., Renaud F. 2002. Sex-biased genetic structure in the vector of Lyme disease, Ixodes ricinus. Evolution, 56(9): 1802. https://doi.org/10.1111/j.0014-3820.2002.tb00194.x
- De Meeûs T., Chan C.T., Ludwig J.M., Tsao J.I., Patel J., Bhagatwala J., Beati L. 2021. Deceptive combined effects of short allele dominance and stuttering: an example with Ixodes scapularis, the main vector of Lyme disease in the U.S.A. Peer Community J., 1: e40. https://doi.org/10.24072/pcjournal.34
- De Meeûs T., Guégan J.F., Teriokhin A.T. 2009. MultiTest V.1.2, a program to binomially combine independent tests and performance comparison with other related methods on proportional data. BMC Bioinform., 10: 1-8. https://doi.org/10.1186/1471-2105-10-443
- De Meeûs T., Humair P.F., Grunau C., Delaye C., Renaud F. 2004. Non-Mendelian transmission of alleles at microsatellite loci: An example in Ixodes ricinus, the vector of Lyme disease. Int. J. Parasitol., 34(8): 943-950. https://doi.org/10.1016/j.ijpara.2004.04.006
- De Meeûs T., McCoy K.D., Prugnolle F., Chevillon C., Durand P., Hurtrez-Boussès S., Renaud F. 2007. Population genetics and molecular epidemiology or how to ′débusquer la bête′. Infect. Genet. Evol., 7(2): 308-332. https://doi.org/10.1016/j.meegid.2006.07.003
- Meirmans P.G. 2006. Using the AMOVA framework to estimate a standardized genetic differentiation measure. Evolution, 60(11): 2399. https://doi.org/10.1111/j.0014-3820.2006.tb01874.x
- Nei M., Chesser R.K. 1983. Estimation of fixation indices and gene diversities. Ann. Hum. Genet., 47(3): 253-259. https://doi.org/10.1111/j.1469-1809.1983.tb00993.x
- Noel V., Leger E., Gómez-Díaz E., Risterucci A.M., McCoy K.D. 2012. Isolation and characterization of new polymorphic microsatellite markers for the tick Ixodes ricinus (Acari: Ixodidae). Acarologia, 52(2): 123-128. https://doi.org/10.1007/s10493-013-9702-x
- Norte A.C., Boyer P.H., Castillo-Ramirez S., Chvostáč M., Brahami M.O., Rollins R.E., Woudenberg T., Didyk Y.M., Derdakova M., Núncio M.S., de Carvalho I.L., Margos G., Fingerle V. 2021. The population structure of Borrelia lusitaniae is reflected by a population division of its Ixodes vector. Microorganisms, 9(5). https://doi.org/10.3390/microorganisms9050933
- Noureddine R., Chauvin A., Plantard O. 2011. Lack of genetic structure among Eurasian populations of the tick Ixodes ricinus contrasts with marked divergence from north-African populations. Int. J. Parasitol., 41(2): 183-192. https://doi.org/10.1016/j.ijpara.2010.08.010
- Van Oosterhout C., Hutchinson W.F., Wills D.P.M., Shipley P. 2004. MICRO-CHECKER: Software for identifying and correcting genotyping errors in microsatellite data. Mol. Ecol. Notes, 4(3): 535-538. https://doi.org/10.1111/j.1471-8286.2004.00684.x
- Patterson J.W., Duncan A.M., McIntyre K.C., Lloyd V.K. 2017. Evidence for genetic hybridization between Ixodes scapularis and Ixodes cookei. Can. J. Zool., 95(8): 527-537. https://doi.org/10.1139/cjz-2016-0134
- Paulauskas A., Radzijevskaja J., Rosef O., Turcinaviciene J., Ambrasiene D., Makareviciute D. 2006. Genetic variation of ticks (Ixodes ricinus L .) in the Lithuanian and Norwegian populations. Exp. Appl. Acarol., 40: 259-270. https://doi.org/10.1007/s10493-006-9035-0
- Peel D., Waples R.S., Macbeth G.M., Do C., Ovenden J.R. 2013. Accounting for missing data in the estimation of contemporary genetic effective population size (Ne). Mol. Ecol. Resour., 13(2): 243-253. https://doi.org/10.1111/1755-0998.12049
- Poli P., Lenoir J., Plantard O., Ehrmann S., Røed K.H., Leinaas H.P., Panning M., Guiller A. 2020. Strong genetic structure among populations of the tick Ixodes ricinus across its range. Ticks Tick. Borne. Dis., 11(6): 101509. https://doi.org/10.1016/j.ttbdis.2020.101509
- Porretta D., Mastrantonio V., Mona S., Epis S., Montagna M., Sassera D., Bandi C., Urbanelli S. 2013. The integration of multiple independent data reveals an unusual response to Pleistocene climatic changes in the hard tick Ixodes ricinus. Mol. Ecol., 22: 1666-1682 https://doi.org/10.1111/mec.12203
- Pritchard J.K., Stephens M., Donnelly P. 2000. Inference of population structure using multilocus genotype data. Genetics. 155(2): 945-959. https://doi.org/10.1093/genetics/155.2.945
- Rizzoli A., Silaghi C., Obiegala A., Rudolf I., Hubálek Z., Földvári G., Plantard O., Vayssier-Taussat M., Bonnet S., Špitalská E., Kazimírová M. 2014. Ixodes ricinus and its transmitted pathogens in urban and peri-urban areas in Europe: New hazards and relevance for public health. Front Public Health. 1(2):251. https://doi.org/10.3389/fpubh.2014.00251
- Røed K.H., Hasle G., Midthjell V., Skretting G., Leinaas H.P. 2006. Identification and characterization of 17 microsatellite primers for the tick, Ixodes ricinus, using enriched genomic libraries. Mol. Ecol. Notes, 6(4): 1165-1167. https://doi.org/10.1111/j.1471-8286.2006.01475.x
- Røed K.H., Kvie K.S., Hasle G., Gilbert L., Leinaas H.P. 2016. Phylogenetic lineages and postglacial dispersal dynamics characterize the genetic structure of the tick Ixodes ricinus in Northwest Europe. PLoS One, 11(12): 1-16. https://doi.org/10.1371/journal.pone.0167450
- Takezaki N., Nei M. 1996. Genetic distances and reconstruction of phylogenetic trees from microsatellite DNA. Genetics, 144(1): 389-399. https://doi.org/10.1093/genetics/144.1.389
- Teriokhin A.T., De Meeûs T., Guégan J.F. 2007. On the power of some binomial modifications of the Bonferroni multiple test. Zh. Obshch. Biol., 68(5): 332-340.
- Untergasser A., Cutcutache I., Koressaar T., Ye J., Faircloth B.C., Remm M., Rozen S.G. 2012. Primer3-new capabilities and interfaces. Nucleic Acids Res., 40(15): 1-12. https://doi.org/10.1093/nar/gks596
- Vitalis R., Couvet D. 2001a. ESTIM 1.0: A computer program to infer population parameters from one- and two-locus gene identity probabilities. Mol. Ecol. Notes, 1(4): 354-356. https://doi.org/10.1046/j.1471-8278.2001.00086.x
- Vitalis R., Couvet D. 2001b. Estimation of effective population size and migration rate from one- and two-locus identity measures. Genetics, 157(2): 911-925. https://doi.org/10.1093/genetics/157.2.911
- Vitalis R., Couvet D. 2001c. Two-locus identity probabilities and identity disequilibrium in a partially selfing subdivided population. Genet. Res., 77(1): 67-81. https://doi.org/10.1017/S0016672300004833
- Wang J. 2015. Does GST underestimate genetic differentiation from marker data? Mol. Ecol., 24(14): 3546-3558. https://doi.org/10.1111/mec.13204
- Waples R.S., Do C. 2008. LDNE: A program for estimating effective population size from data on linkage disequilibrium. Mol. Ecol. Resour., 8(4): 753-756. https://doi.org/10.1111/j.1755-0998.2007.02061.x
- Weir B.S., Cockerham C.C. 1984. Estimating F-statistics for the analysis of population structure. Evolution, 38(6): 1358-1370. https://doi.org/10.2307/2408641
- Wilhelmsson P., Jaenson T.G.T., Olsen B., Waldenström J., Lindgren P.E. 2020. Migratory birds as disseminators of ticks and the tick-borne pathogens Borrelia bacteria and tick-borne encephalitis (TBE) virus: a seasonal study at Ottenby Bird Observatory in South-eastern Sweden. Parasites Vectors, 13(1). https://doi.org/10.1186/s13071-020-04493-5
- Wright S. 1965. The interpretation of population structure by F-statistics with special regard to systems of mating. Evolution, 19(3): 395-420. https://doi.org/10.2307/2406450
- Younsi H., Fares W., Cherni S., Dachraoui K., Barhoumi W., Najjar C., Zhioua E. 2020. Ixodes inopinatus and Ixodes ricinus (Acari: Ixodidae) are sympatric ticks in North Africa. J. Med. Entomol., 57(3): 952-956. https://doi.org/10.1093/jme/tjz216


2022-10-11
Date accepted:
2023-03-19
Date published:
2023-03-27
Edited by:
Roy, Lise

This work is licensed under a Creative Commons Attribution 4.0 International License
2023 Velez, Rita; De Meeûs, Thierry; Beati, Lorenza; Younsi, Hend; Zhioua, Elyes; Antunes, Sandra; Domingos, Ana; Ataíde Sampaio, Daniel; Carpinteiro, Dina; Moerbeck, Leonardo; Estrada-Peña, Agustin; Santos-Silva, Maria Margarida and Santos, Ana Sofia
 Download article
Download the citation
RIS with abstract
(Zotero, Endnote, Reference Manager, ProCite, RefWorks, Mendeley)
RIS without abstract
BIB
(Zotero, BibTeX)
TXT
(PubMed, Txt)