


Changes in a soil microarthropod community in the vicinity of dominant tree species under trampling management at the Safari Zoological Center, Israel
Liu, Rentao1 ; Meller, Roy2 and Steinberger, Yosef3
1Key Laboratory for Restoration and Reconstruction of Degraded Ecosystem in Northwestern China of Ministry of Education, Ningxia University, Yinchuan 750021, China & The Mina and Everard Goodman Faculty of Life Sciences, Bar-Ilan University, Ramat-Gan 5290002, Israel.
2The Mina and Everard Goodman Faculty of Life Sciences, Bar-Ilan University, Ramat-Gan 5290002, Israel.
3The Mina and Everard Goodman Faculty of Life Sciences, Bar-Ilan University, Ramat-Gan 5290002, Israel.
2019 - Volume: 59 Issue: 1 pages: 33-45
https://doi.org/10.24349/acarologia/20194308Original article
Keywords
Abstract
Introduction
Animal trampling and grazing has both direct and indirect effects on vegetation and soils, which alter the distribution of soil invertebrate communities (Denmead et al., 2015). Bardgett et al. (2001) and Bugalho et al. (2011) reported that livestock trampling not only affected the physical habitats of soil organisms through compaction by the hooves, but also influenced biological processes that affect soil nutrients. Liu et al. (2017) indicated that perennial grazing had a large effect on soil fauna of the subalpine meadows in the Tibetan region. Bardgett and Wardle (2003) reported the effect of grazing practices on below-ground faunal communities. Holmquist et al. (2013) elucidated the potential negative effect of livestock trampling on arthropod assemblages. However, reduced trampling pressure could increase species richness and the abundance of phytophagous insects (Parfitta et al., 2010; Bugalho et al., 2011). The ungulate trampling management was found to have a significant effect on a soil biotic community (Galli et al., 2015). Soil microarthropods are an important component of terrestrial ecosystems due to their role as regulators of key processes, such as plant litter decomposition and mineralization (Kampichler and Bruckner, 2009), soil formation (Persson, 1989), and nutrient cycling (Powers et al., 1998). Understanding the abundance and diversity distribution of soil microarthropods as affected by trampling management could be beneficial for the design and management of intensive land-use systems (Barrios et al., 2012).
Plant canopies as food resources and shelter refuges could play an important role in ungulates activities and trampling (Shinoda and Akasaka, 2017). Canopy habitats of different tree species could harbor distinctive variations of leaves and herbaceous vegetation, thus affecting the behavior of wandering herbivore animals (Blaum et al. 2009; Seeber et al., 2008; 2009). In addition, tree canopy and crown structure could modify soil conditions beneath the canopy, including soil moisture, temperature, carbon substrate availability and nutrient regimes through shading, root turnover, and litter inputs (Kamau et al., 2017). Tree stemflow could contribute nutrients to the soil at the base of trees through the washing of dust, insect remains, or bird droppings from the leaves and bark (Rhoades, 1997). Soil properties related to tree canopies, such as quantity and quality of resources as well as changes in soil chemistry beneath trees, play an important role not only in food selection of herbivores, but also in the distribution and composition of soil biota and related soil processes (Belsky and Blumenthal, 1997; Ayuke et al., 2009; Pauli et al., 2011; Mbau et al., 2015).
A zoological garden in a city is an important place for people of all ages to enjoy leisure time (Adams and Azubuike, 2014). The nature of such a site is that there are many ungulates fed by professional attendants (Blaszkiewitz, 2014). Our study area is the "Safari", the largest zoo in Israel; it simulates an African Savannah and is populated by more than five hundred ungulates (Meller, 2015). The ungulate activities, including wandering around the zoological garden, could cause soil compaction by trampling and affect plant growth by gnawing (Holtmeier, 2012; Meller, 2015). In order to alleviate the effects of ungulate activities on soil ecological process and grazing on trees, enclosures are fenced with barbed wire and/or steel pipe column around some trees. This trampling management, combined with plant species, could lead to variation of spatial patterns of resource distribution, affecting not only soil abiotic but also soil biotic activity distribution (Bugalho et al., 2011; Pen-Mouratov et al., 2016). In all, the heterogeneity of soil resources around a tree canopy, combined with trampling activities, was found to be a distinct area of favorable or unfavorable conditions, structuring the diversity distribution of soil arthropods (Korboulewsky et al., 2016; Kamau et al., 2017; Liu et al., 2017).
Understanding soil biotic distribution beneath plant canopies under trampling management could enhance in-depth understanding of biodiversity conservation, land management, and rehabilitation measures in Safari Zoological garden ecosystems (de Gouvenain, 1996). Up to now, there were only a few reports regarding the effect of tree species under trampling management on soil free-living nematodes (Pen-Mouratov et al., 2016) and soil microbiology (Meller, 2015). Little is known about the magnitude and pattern of both influences of tree species and grazing management on soil microarthropods in Safari Zoological Center habitats. The objectives of the present study were (1) to probe into the changes of physicochemical characteristics beneath plant canopy of dominant tree species under contrasting trampling and enclosure treatments; (2) to examine the effect of plant canopy on the abundance of soil microarthropods and soil Acari diversity under contrasting grazing treatments at the Safari Zoological Center, Israel; and (3) to assess the determinants of soil physicochemical characteristics on soil microarthropod abundance and Acari diversity. We hypothesized that (1) no grazing under enclosure could increase soil microarthropod and Acari diversity relative to grazing treatments; (2) the diversity of soil microarthropods under the tree canopy will be similar for three dominant tree species.
Materials and methods
Site description
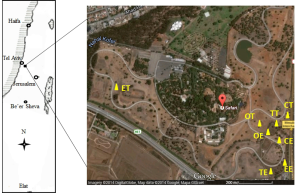
The field experiment was set up at the Safari Zoological Center (E 34.82’, N 32.04’; elevation 80 m above sea level) in Ramat-Gan, Israel (Fig. 1). The center was founded in 1974 in the format of an African safari, occupying 250 acres of nature in the heart of a densely populated urban area (http://www.safari.co.il/). The region has a typical Mediterranean climate, characterized by a short, cool, wet winter and a long, hot, dry summer, with a dry-out transition season in spring. The mean annual rainfall is 500 mm, and the mean annual temperature is 14 °C, with a maximum of 30 °C in summer and a minimum of 7 °C in winter (data from the Israel Meteorological Service). The soil types belong to the Grumsols and are dark, dull-colored clay soil according to the local Israeli classification system. The electrical conductivity is 0.73 mmho cm-1, and the texture is sandy clay soil with 46.8%, 12.4%, and 40.7% of clay, silt, and sand, respectively. The CaCO3 content is 88.7%, and according to SSA (Soil Science of America – standards), the calcium carbonate content is 234 m2 g-1 (Dan and Koyumdjiski, 1979).

The Safari Zoological Center has the largest animal collection in the Middle East and is unique in the world because of the large herds of mixed species of African animals that roam the spacious African Park (for details, please go to http://www.safari.co.il/). The African Park and the zoo are home to 1,600 animals of different species, among them 68 species of mammals, 130 species of fowl, and 25 species of reptiles. Especially notable are its breeding herds of African and Asian elephants, the gorilla, chimpanzee, and orangutan families, the hippo herd, and the pride of lions. As in their natural habitats on the continent of Africa, the animals wander freely in large herds.
The Casuarina sp., Cupressus sp., Eucalyptus sp., Ficus sp., and Tamarix sp. are among the most dominant trees, and are found in the area most frequently visited by the animals in the African Safari section. Trees, such as the Cupressus sempervirens, Eucalyptus camaldulensis, and Tamarix aphylla, provide shelter for many animals, especially the ungulates that inhabit the study area. Some of these trees are fenced and not available as shelter, which allows for comparative research on the impact of ungulate trampling.
Experimental setup
The paired habitats under contrasting trampling and enclosure managements beneath E. camaldulensis, T. aphylla, and C. sempervirens canopy as well as in adjacent open spaces (as control) were selected as sampling sites (Table 1; Fig. 1). Each paired habitat was represented by four replicate sites, with the total of 32 sampling sites obtained (i.e., 4 replicates × 4 pairs × 2 habitats per pair). The area of each paired sites ranged from 5×5 m2 to 8×8 m2. Each trampling habitats harbored more than six animals (ca. 1470-2356 kg per animal) per hectare during the period of over 30 years. Within each paired site, five sampling points were set up for soil sample collection.
Habitat
Code
Treatment
Tree height (m)
Tree canopy crown (m2)
Herbaceous vegetation
Soil
physical/biological top layer
Litter layer (cm)
Open spaces
OT
Trampling
-
-
No
No
No
OE
Enclosure
-
-
+++
Physical top layer
No
E. camaldulensis
ET
Trampling
10-13
6×8
No
No
No
EE
Enclosure
+
Biological top layer
2-3
T. aphylla
TT
Trampling
14-16
8×8
No
No
No
TE
Enclosure
+++
Physical top layer
Few
C. sempervirens
CT
Trampling
14-16
7×9
No
No
No
CE
Enclosure
+
Biological layer
1-2

Within each paired site, a soil composite sample from adjacent five soil cores at five sampling points was collected with an auger (diameter of 15 cm) at a depth of 0-10 cm after removing the upper litter layer. The collected soil samples were stored in sealed bags and kept in a cooler box during sample collection and transportation to the laboratory for soil arthropod extraction and soil physicochemical analysis. In addition, another intact soil core was collected for the determination of soil bulk density. The field study was conducted during the wet winter season in December of 2013, which enhanced biological activity in soil profiles.
Soil microarthropod collection and identification
The soil arthropods were extracted from the soil using 1/4 of the soil composite sample in a modified high-gradient Tullgren funnel (Crossley and Blair, 1991) for 72 h at room temperature, after which the substrate was reweighed to obtain dry weight. The extracted soil arthropods were preserved in 75% ethanol. Mites (Acari) and springtails (Collembola) were counted using a stereomicroscope (SMZ-168-B). The Acari were further identified to suborder and species levels using a compound microscope (BA410, Micro China Group Co. Ltd. Hainan) according to the keys provided in “A Manual of Acarology” (Krantz and Walter, 2009); a detailed list of taxa could be seen in the Supporting Information (Table S1). The springtails were regarded as one group due to the limited knowledge of Collembola identification.
Soil microarthropod abundance was expressed as the number of individuals per 10 grams dry weight of substrate. In addition, the soil Acari diversity indices, including taxonomic richness (number of taxa), Shannon index, Simpson index, and evenness index were calculated based on the abundance of Acari families.
Determination of soil physicochemical properties
The intact soil cores mentioned above were used for soil density (SD, g cm-3) determined as the dry weight per unit volume. The soil composite samples obtained from the field (i.e., the remaining 3/4 of the soil composite sample) were sieved through a 2-mm sieve in order to remove plant parts and other debris. After this process, the following physicochemical parameters were determined: (a) soil moisture (SM, %) ndash; oven-dried at 105 °C for 48 h for determination of soil gravimetric moisture content; (b) organic matter (OM, %) was determined by the K2Cr2O7–H2SO4 oxidation method of Walkley and Black (Rowell, 1994); (c) soil pH (pH) was measured with a potentiometric glass electrode using a 1:2 soil:water ratio; (d) soil electrical conductivity (SEC, µ cm-1) was determined in a 1:5 (v/v) soil water aqueous extract; and (e) soil water-holding capacity (WHC, %) was determined by the amount of water held between field capacity and wilting point.
Statistical analysis
All statistical analyses were carried out using version 15.0 of SPSS for Windows (SPSS Inc., Chicago, IL). We used the general linear model to test the interactive effects of tree species and trampling management on soil parameters, abundance of soil microarthropods, and the diversity indices of soil Acari community. Multiple comparisons with post-hoc Tukey HSD (honestly significant difference) were used to determine the differences between sites in terms of tree species and trampling management. Pearson correlation analysis was carried out to determine the strength of the relationship between abundance and diversity of microarthropods, and soil properties. Before applying parametric tests, we tested for normality and homogeneity of variances. Statistically significant differences were assigned to p < 0.05 for all tests.
Results
Environmental parameters
Soil electrical conductivity was consistently greater under trampling than under enclosure, regardless of habitats beneath tree canopy and in open spaces (Tables 2 and 3). Soil electrical conductivity was found to be markedly greater beneath tree canopy habitats in comparison with open spaces when under trampling, and markedly greater values were found beneath the C. sempervirens tree canopy habitats in comparison with the other habitats when under enclosure. In contrast, soil water-holding capacity was lower under trampling than under enclosure, regardless of tree species. The water-holding capacity was greater in the soils beneath C. sempervirens and T. aphylla canopy in comparison with the E. camaldulensis canopy and open spaces when under trampling.
SM (%)
OM (%)
pH
SEC (µ cm-1)
SD (g cm-3)
WHC (%)
OE
25.6±3.4a
1.1±0.2b
7.5±0.2b
87.6±17.5d
1.1±0.0b
53.6±0.9ab
OT
7.8±1.7c
0.2±0.0e
7.6±0.0b
150.3±51.3c
1.6±0.0a
25.6±1.0c
EE
16.6±1.6b
1.3±0.2b
7.6±0.0b
130.2±9.4cd
1.0±0.1c
52.6±11.1ab
ET
23.2±3.8a
2.0±0.3a
7.6±0.0b
255.3±39.6ab
1.1±0.0bc
31.9±3.5c
TE
21.9±4.4ab
0.4±0.1d
7.9±0.0a
152.0±17.8c
1.0±0.1c
52.1±14.6ab
TT
14.1±5.2b
1.1±0.1b
7.6±0.1b
254.1±48.0ab
1.0±0.1c
43.3±6.2b
CE
26.9±3.4a
0.8±0.3c
7.6±0.1b
209.9±22.5b
1.0±0.1c
56.3±5.8a
CT
22.0±6.0ab
0.5±0.2d
7.8±0.1a
275.9±21.9a
1.0±0.0c
43.0±3.9b
Microarthropods
df
F
Soil parameters
df
F
Total microarthropod
abundance
Soil moisture
Model
8
15.85***
Model
8
109.38***
Trampling
1
39.13***
Trampling
1
18.46***
Habitat
3
1.65
Habitat
3
5.90**
Trampling * Habitat
3
4.89**
Trampling * Habitat
3
12.84***
Collembola abundance
Organic matter
Model
8
4.90**
Model
8
116.32***
Trampling
1
11.18**
Trampling
1
0.05
Habitat
3
2.29
Habitat
3
48.99***
Trampling * Habitat
3
2.56
Trampling * Habitat
3
32.99***
Other
arthropod abundance
Soil pH
Model
8
1
Model
8
35120.21***
Trampling
1
1.8
Trampling
1
0.5
Habitat
3
0.73
Habitat
3
4.69*
Trampling * Habitat
3
0.73
Trampling * Habitat
3
13.93***
Soil
Acari abundance
Electrical conductivity
Model
8
18.85***
Model
8
156.31***
Trampling
1
43.09***
Trampling
1
61.80***
Habitat
3
0.88
Habitat
3
20.89***
Trampling * Habitat
3
3.60*
Trampling * Habitat
3
1.76
Taxon
richness of soil Acari
Soil density
Model
8
16.11***
Model
8
1769.86***
Trampling
1
34.68***
Trampling
1
57.12***
Habitat
3
3.17*
Habitat
3
82.99***
Trampling * Habitat
3
1.23
Trampling * Habitat
3
36.99***
Shannon
index of soil Acari
Water-holding capacity
Model
8
18.88***
Model
8
155.49***
Trampling
1
51.07***
Trampling
1
45.98***
Habitat
3
4.03*
Habitat
3
3.22*
Trampling * Habitat
3
0.78
Trampling * Habitat
3
2.6
Simpson
index of soil Acari
Model
8
13.42***
Trampling
1
0
Habitat
3
7.47**
Trampling * Habitat
3
5.22**
Evenness
index of soil Acari
Model
8
42.11***
Trampling
1
120.61***
Habitat
3
3.68*
Trampling * Habitat
3
1.82
The average soil moisture content in open places was significantly lower under trampling than under enclosure, while the habitats beneath the E. camaldulensis canopy followed a contrasting pattern, with greater values under trampling relative to enclosure (Tables 2 and 3). The amount of soil organic matter was lower under trampling than under enclosure in open spaces and beneath C. sempervirens canopy, in contrast to the pattern in both E. camaldulensis and T. aphylla canopy habitats. Soil pH was markedly lower under trampling than under enclosure in the T. aphylla canopy habitat, in contrast to the pattern in the C. sempervirens canopy habitat. Soil bulk density was markedly greater under trampling than under enclosure in open spaces, where it was found to be a considerably greater relative to tree-canopy habitats.
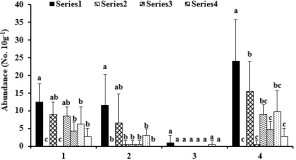
Soil microarthropod abundance
There was a greater abundance of total microarthropods under enclosure than under trampling both in open spaces and beneath the E. camaldulensis canopy (Fig. 2; Table 3). The open spaces under enclosure had greater abundance of total microarthropods than all other habitats, regardless of tree species. The average abundance of soil Acari and Collembola followed a distribution pattern similar to that of total abundance (Fig. 2; Table 3). However, there were no significant differences in the average abundance of total microarthropods, soil Acari and Collembola between trampling and enclosure beneath either T. aphylla or C. sempervirens canopy. There was little effect of tree species, trampling management, or their interaction on the average abundance distribution of ‘other soil arthropods’ since only a few individuals were found in the soils.

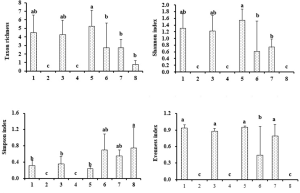
Taxon richness and diversity indices of the soil Acari community
The taxon richness, Shannon index, and evenness index of the soil Acari community were greater under enclosure than under trampling in the open spaces and beneath the tree canopy habitats, with the exception of taxon richness beneath the C. sempervirens canopy (Fig. 3; Table 3). The T. aphylla canopy habitat under enclosure had the greatest taxon richness and Shannon index of the soil Acari community relative to all other habitats. The T. aphylla canopy habitats under trampling had greater evenness index in comparison with all the other habitats. Simpson index was significantly greater under enclosure conditions than under trampling in open spaces and beneath the C. sempervirens canopy. However, there were no significant differences in taxon richness between trampling and enclosure under the C. sempervirens canopy (Fig. 3). There were no significant differences in taxon richness and Shannon index between the open spaces and beneath E. camaldulensis and T. aphylla canopy, and no significant differences in the evenness index were found between all the eight habitats when under enclosure. There were no significant differences in the Simpson index between enclosure and trampling treatment beneath both T. aphylla and E. camaldulensis canopies.

The relationship between community indices and soil factors
The abundance of total microarthropods was negatively correlated with soil pH and electrical conductivity while it was positively correlated with soil water-holding capacity. Abundance of soil Acari was positively correlated with soil moisture and water-holding capacity, and negatively correlated with soil bulk density (Table 4). The Collembola abundance was negatively correlated with soil pH and electrical conductivity. The taxon richness, Shannon index, and evenness index of the soil Acari community were negatively correlated with soil electrical conductivity, while positively correlated with soil water-holding capacity (Table 4). The evenness index was positively correlated with soil moisture while negatively correlated with soil density. The Simpson index was negatively correlated with soil density.
Index
SM
OM
pH
SEC
SD
WHC
Abundance
Acari
0.349*
0.068
-0.198
-0.506**
-0.299
0.571***
Collembola
0.153
0.210
-0.486**
-0.506**
-0.107
0.207
Other soil arthropo
0.202
0.098
-0.294
-0.209
-0.065
0.245
Total microarthrop
0.292
0.158
-0.403*
-0.574***
-0.233
0.445*
Diversity indices of Acari
Taxon richness
0.253
0.023
-0.098
-0.392*
-0.316
0.561***
Shannon index
0.285
0.032
-0.120
-0.455**
-0.293
0.585***
Simpson index
-0.006
-0.175
0.165
0.240
-0.475**
0.336
Evenness index
0.387*
0.009
-0.203
-0.466**
-0.411*
0.739***
Discussion
The pattern of soil moisture content, organic matter, and water-holding capacity in the open spaces differed between trampling and enclosure conditions from that of soil electrical conductivity and soil density, which was in accordance with the results of Liu et al. (2013) and Su et al. (2005). The greater soil electrical conductivity under trampling in comparison with enclosure conditions was attributed to animal excreta with high salinity content mixed with the soils as a result of animal trampling activities (Steffens et al., 2008). In our study, the pattern of soil density differed between trampling and enclosure conditions under three tree canopies in contrast to the pattern at the open spaces, suggesting that the soil habitats under the canopies of trees with developed root systems could mediate the effect of trampling management on soil density (Steffens et al., 2008). The pattern of soil electrical conductivity between trampling and enclosure conditions was similar beneath each canopy habitat to that in the open spaces, in contrast to the results obtained from grassland ecosystems showing no marked effect of trampling management on soil electrical conductivity (Liu et al., 2012).
The lower soil-moisture content observed under enclosure conditions in comparison with trampling conditions beneath the E. camaldulensis canopy was in contrast to the finding of Belsky and Blumenthal (1997). This result could be explained by the presence of a litter layer that covered the soil surface and controlled the amount of rainfall entering the belowground soils (Lull, 1959). However, no significant differences in soil moisture content between trampling and enclosure conditions beneath either T. aphylla or C. sempervirens canopy were attributed to their canopy crown structure, with needle leaves accumulated on the soil surface, as reported by Saetre and Baath (2000). The greater amount of organic matter accumulated beneath the E. camaldulensis and T. aphylla canopy under trampling could be explained by the presence of many feces as a result of ungulate trampling activities (Su et al., 2005). A similar pattern of soil water-holding capacity between trampling and enclosure beneath each canopy habitat relative to open spaces, confirmed a greater soil water-holding capacity under multi-paddock trampling conditions in comparison with ungrazed soil areas, as shown by Teague et al. (2011). However, no significant differences were found in soil pH between trampling and enclosure conditions in the open spaces, thus confirming the findings of Steffens et al. (2008) who reported no effect of trampling management on soil pH.
Regarding total microarthropod distribution under trampling and enclosure conditions, a similar pattern was found between the open spaces and the E. camaldulensis canopy habitats, suggesting the effect of trampling disturbances on plant-associated animal communities, and thus on soil milieu inhabitants (e.g., invertebrates), as reported by Bardgett et al. (2001), Grayston et al. (2001), and Parfitta et al. (2010). It was reported that trampling activities could negatively affect soil arthropods, and sufficiently heavy trampling pressure was found to produce detrimental effects on arthropod assemblages (Liu et al., 2013; Gonzalez-Megias et al., 2004; Lindsay and Cunningham, 2009). However, the pattern of total microarthropod abundance under trampling and enclosure conditions beneath C. sempervirens and T. aphylla canopies was different from the E. camaldulensis canopy habitats. This finding was attributed to tree-canopy architecture, the accumulation of organic matter, and soil moisture-content distribution within the canopy systems (Winchester and Behan-Pelletier, 2003). Similarly, the abundance distribution of soil Acari and Collembola was greater under enclosure than under trampling in the open spaces and beneath the E. camaldulensis canopy, indicating a detrimental effect of trampling on soil microarthropods, including both Acari and Collembola (Parfitta et al., 2010).
Comparably, no significant differences in total soil microarthropod abundance between trampling and enclosure were found in the vicinity of C. sempervirens or T. aphylla canopy habitats, which could be explained by the fact that almost no litter layer covered the soil surface that affected soil moisture content. Similar distribution of soil moisture content under trampling and enclosure conditions beneath both T. aphylla and C. sempervirens canopy habitats confirmed this point. It was reported that water availability played implications on soil animal-community composition and functioning (Sylvain et al., 2014). All these findings indicated a homogeneous distribution of soil microarthropods under both trampling and enclosure conditions beneath both such canopy habitats (i.e., T. aphylla and C. sempervirens). Also, no significant differences in abundance distribution of soil Acari and Collembola between trampling and enclosure beneath C. sempervirens and T. aphylla habitats canopy, suggested a homogeneous distribution of soil microarthropod abundance regardless of trampling treatment. This finding was similar to the results of Winchester et al. (1999) and Lindo and Winchester (2006). They reported that the feeding habits and niche specialization of soil Acari and Collembola due to morphological and physiological modifications resulted in the differences in abundance differences between canopy habitats in terms of tree species under trampling management.
Tree canopies were reported to modify soil moisture, temperature, carbon substrate availability, and nutrient regimes through shading, root turnover, and litter inputs (Kamau et al., 2017), which could, therefore, affect the distribution of soil arthropods as indicated by Pauli et al. (2011) and as found in our study. Plant stemflow and changes in soil chemistry beneath tree canopies could potentially affect the occurrence and distribution of soil invertebrates, as indicated by Rhoades (1997), Ayuke et al. (2009), Pauli et al. (2011), and Mbau et al. (2015). The present study could be considered as a first step in probing into the tree canopy and herbivore trampling effects on the spatial distribution of soil microarthropods, since there is little information available on soil arthropods under trampling management in zoological ecosystems. As such, it is necessary to develop an in-depth research that addresses spatial patterns of soil microarthropod communities as affected by tree attributes under contrasting trampling management conditions (Kamau et al., 2017).
There was also a detrimental effect of trampling on the taxon richness, Shannon index, evenness index, and Simpson index of soil Acari communities in open spaces, which was in agreement with Galli et al. (2015). This pattern was also true for the Shannon index and evenness index of soil Acari communities in all the habitats beneath the tree canopies, and for the taxon richness and Simpson index of soil Acari communities beneath the E. camaldulensis and T. aphylla canopy habitats. Pearson analysis indicated a negative correlation of taxon richness, Shannon index, and evenness index with soil electrical conductivity, while it indicated a positive correlation of these three diversity indices with soil water-holding capacity. It was found that there was a positive correlation of the evenness index with soil moisture. The considerably lower values of taxon richness and Shannon diversity index as a result of trampling disturbance thereby created a series of negative feedbacks in the soil degradation processes that continued to degrade the system (Bugalho et al., 2011; Galli et al., 2015). However, no significant differences in the taxon richness and Simpson index of soil Acari communities between trampling and enclosure conditions beneath the C. sempervirens canopy were found. This could be explained by the availability of suitable habitats and food resources. Anderson (1977) reported that most of the soil arthropod distribution was on the basis of microhabitat associations and feeding preferences. The decreased habitat heterogeneity beneath the C. sempervirens canopy could be a determining factor in shaping the oribatid mite communities of the Mediterranean Safari Zoological Center (Lindo and Winchester, 2006).
Conclusions
It was found that there was an interactive effect of tree canopy habitats and trampling management on soil moisture, organic matter, pH, and soil density. There was a marked effect of a single factor (i.e., tree species or trampling management) on soil electrical conductivity and on soil water-holding capacity. Likewise, there was an interactive effect of tree species and trampling management on the abundance of total soil microarthropods, including soil Acari and Collembola. There was a detrimental effect of trampling on the abundance of soil microarthropods and on the diversity of soil Acari in some cases only. The ecophysiological attributes of the C. sempervirens canopy could mediate the negative effect of trampling and benefit soil microarthropods. Therefore, adequate protection and management of the Safari Zoological Garden soils should be carried out to curb the unsustainable trampling activities, thereby allowing the arthropods to occupy their niche in the zoological ecosystem.
Acknowledgements
We thank the anonymous reviewers for their valuable comments. We thank Dr. Haggai Wasserstrom for his help with the identification of soil microarthropod samples and thank Dr. Chen Sherman and Dr. Stanislav Pen-Mouratov for scientific assistance in the field and lab. Special thanks to Ms. Sharon Victor for her useful comments. This paper was financially supported by CSC/BIU Joint Scholarships of The KORT 25 Postdoc Program, National Natural Science Foundation (41661054; 41867005), Ningxia Higher Education Foundation (NGY2018007), Specialized Foundation for Innovative Platform of Fundamental Condition Construction in Ningxia Science and Technology (2018DPC05021), Ningxia Natural Science Foundation (2018AAC02004), and Project of First-Class Discipline Construction (Ecology) for Ningxia Higher Education (NXYLXK2017B06) to Rentao Liu.
References
Adams A., Azubuike A. 2014. Impacts of zoological garden in schools (a case study of zoological garden, Kano State Nigeria). Open J. Ecol., 4: 612-618. doi:10.4236/oje.2014.410051 ![]()
Anderson J.M. 1977. The organization of soil animal communities. Ecol. Bull., 25: 15-23.
Ayuke F.O., Karanja N.K., Muya E.M., Musombi B.K., Mungatu J., Nyamasyo G.H.N. 2009. Macrofauna diversity and abundance across different land use systems in Embu, Kenya. Trop. Subtrop. Agroecosyst., 11/2: 371-384.
Bardgett R.D., Jones A.C., Jones D.L., Kemmitt S.J., Cook R., Hobbs P.J. 2001. Soil microbial community patterns related to the history and intensity of grazing in sub-montane ecosystems. Soil Biol. Biochem., 33: 1653-1664. doi:10.1016/S0038-0717(01)00086-4 ![]()
Bardgett R.D., Wardle D.A. 2003. Herbivore-mediated linkages between aboveground and belowground communities. Ecology, 84: 2258-2268. doi:10.1890/02-0274 ![]()
Barrios E., Sileshi G.W., Shepherd K., Sinclair F. 2012. Agroforestry and soil health: linking trees, soil biota and ecosystem services. In: Wall D.H., Bardgett R.D., Behan-Pelletier V., J.E. H., Jones H., Ritz K., Six J., Strong D.R., van der Putten W.H. (Eds). Soil ecology and ecosystem services. Oxford: Oxford University Press. pp. 315-330. doi:10.1093/acprof:oso/9780199575923.003.0028 ![]()
Belsky A.J., Blumenthal D.M. 1997. Effects of livestock grazing on stand dynamics and soils in upland forests of the interior West. Conserv. Biol., 11: 315-327. doi:10.1046/j.1523-1739.1997.95405.x ![]()
Blaszkiewitz B. 2014. Biodiversity and zoological gardens. Der Zool. Garten, 83: 33-41. doi:10.1016/j.zoolgart.2014.07.003 ![]()
Blaum N., Seymour C., Rossmanith E., Schwager M., Jeltsch F. 2009. Changes in arthropod diversity along a land use driven gradient of shrub cover in savanna rangelands: identification of suitable indicators. Biodivers. Conserv., 18: 1187-1199. doi:10.1007/s10531-008-9498-x ![]()
Bugalho M.N., Lecomte X., Goncalves M., Caldeira M.C., Branco M. 2011. Establishing grazing and grazing-excluded patches increases plant and invertebrate diversity in a Mediterranean oak woodland. Forest Ecol. Manage., 261: 2133-2139. doi:10.1016/j.foreco.2011.03.009 ![]()
Crossley D.A., Blair J.M. 1991. A high-efficiency, low-technology Tullgren-type extractor for soil microarthropods. Agric. Ecosyst. Environ. 34:187-192. doi:10.1016/0167-8809(91)90104-6 ![]()
Dan J., Koyumdjiski H. 1979. The classification of Israel soils by the committee on soil classification in Israel. Special publication no. 137. Bet Dagan, Israel: Division of Scientific Publications, The Volcani Center.
de Gouvenain R.C. 1996. Indirect impacts of soil trampling on tree growth and plant succession in the North Cascade Mountains of Washington. Biol. Conserv., 75: 279-287. doi:10.1016/0006-3207(95)00036-4 ![]()
Denmead L.H., Barker G.M., Standish R.J., Didham R.K. 2015. Experimental evidence that even minor livestock trampling has severe effects on land snail communities in forest remnants. J. Applied. Ecol., 52: 161-170. doi:10.1111/1365-2664.12370 ![]()
Galli L., Bonacchi A., Capurro M., Conti I., Crovetto F., Ferrari C., Mentqa C., Conti F.D. 2015. Assessment of the impact of trampling on soil Arthropoda in a Mediterranean habitat. Acta Soc. Zool. Bohemicae, 79: 193-198.
Gonzalez-Megias A., Gomez J.M., Sanchez-Pinero F. 2004. Effects of ungulates on epigeal arthropods in Sierra Nevada National Park (southeast Spain). Biodivers. Conserv., 13: 733-752. doi:10.1023/B:BIOC.0000011723.82351.82 ![]()
Grayston S.J., Griffith G.S., Mawdsley J.L., Campbell C.D., Bardgett R.D. 2001. Accounting for variability in soil microbial communities of temperate upland grassland ecosystems. Soil Biol. Biochem., 33: 533-551. doi:10.1016/S0038-0717(00)00194-2 ![]()
Holmquist J.G., Schmidt-Gengenbach J., Haultain S.A. 2013. Effects of a long-term disturbance on arthropods and vegetation in subalpine wetlands: Manifestations of pack stock grazing in early versus mid-season. PLOS ONE, 8: ARTN e54109. doi:10.1371/journal.pone.0054109 ![]()
Holtmeier F.K. 2012. Impact of wild herbivorous mammals and birds on the altitudinal and northern treeline ecotones. Landscape Online, 30: 1-28. doi:10.3097/LO.201230 ![]()
Kamau S., Barrios E., Karanja N.K., Ayuke F.O., Lehmann J. 2017. Soil macrofauna abundance under dominant tree species increases along a soil degradation gradient. Soil Biol. Biochem., 112: 35-46. doi:10.1016/j.soilbio.2017.04.016 ![]()
Kampichler C., Bruckner A. 2009. The role of microarthropods in terrestrial decomposition: a meta-analysis of 40 years of litterbag studies. Biol. Rev., 84: 375-389. doi:10.1111/j.1469-185X.2009.00078.x ![]()
Korboulewsky N., Perez G., Chauvat M. 2016. How tree diversity affects soil fauna diversity: A review. Soil Biol. Biochem., 94: 94-106. doi:10.1016/j.soilbio.2015.11.024 ![]()
Krantz G.W., Walter D.E. 2009. A manual of acarology, 3rd edition. Lubbock, TX: Texas Tech University Press.
Lindo Z., Winchester N.N. 2006. A comparison of microarthropod assemblages with emphasis on oribatid mites in canopy suspended soils and forest floors associated with ancient western redcedar trees. Pedobiologia, 50: 31-41. doi:10.1016/j.pedobi.2005.09.002 ![]()
Lindsay E.A., Cunningham S.A. 2009. Livestock grazing exclusion and microhabitat variation affect invertebrates and litter decomposition rates in woodland remnants. Forest Ecol. Manage. 258: 178-187. doi:10.1016/j.foreco.2009.04.005 ![]()
Liu J.L., Li F.R., Liu C.A., Liu Q.J. 2012. Influences of shrub vegetation on distribution and diversity of a ground beetle community in a Gobi desert ecosystem. Biodivers. Conserv., 21: 2601-2619. doi:10.1007/s10531-012-0320-4 ![]()
Liu R.T., Zhao H.L., Zhao X.Y., Zhu F. 2013. Effects of cultivation and grazing exclusion on the soil macro-faunal community of semiarid sandy grasslands in northern China. Arid Land Res. Manage. 27: 377-393. doi:10.1080/15324982.2013.787470 ![]()
Liu S.J., Yang X.D., Ives A.R., Feng Z.L., Sha L.Q. 2017. Effects of seasonal and perennial grazing on soil fauna community and microbial biomass carbon in the subalpine meadows of Yunnan, Southwest China. Pedosphere, 27: 371-379. doi:10.1016/S1002-0160(17)60325-4 ![]()
Lull H.W. 1959. Soil compaction on forests and rangelands. Miscellaneous publication. Washington, D.C.: U.S. Department of Agriculture.
Mbau S.K., Karanja N., Ayuke F. 2015. Short-term influence of compost application on maize yield, soil macrofauna diversity and abundance in nutrient deficient soils of Kakamega County, Kenya. Plant Soil, 387: 379-394. doi:10.1007/s11104-014-2305-4 ![]()
Meller R. 2015. Ungulates and trees effects on a soil microbial community and its functional diversity [MSc Thesis]. Ramat-Gan: Bar-Ilan University.
Parfitta R.L., Yeates G.W., Ross D.J., Schon N.L., Mackay A.D., Wardle D.A. 2010. Effect of fertilizer, herbicide and grazing management of pastures on plant and soil communities. Appl. Soil Ecol., 45: 175-186. doi:10.1016/j.apsoil.2010.03.010 ![]()
Pauli N., Barrios E., Conacher A.J., Oberthur T. 2011. Soil macrofauna in agricultural landscapes dominated by the Quesungual Slash-and-Mulch Agroforestry System, western Honduras. Appl. Soil Ecol., 47: 119-132. doi:10.1016/j.apsoil.2010.11.005 ![]()
Pen-Mouratov S., Meller R., Liu R.T., Steinberger Y. 2016. Animal trampling effects on soil free-living nematodes in a man-made safari-zoo habitat. In. The 32nd European Society of Nematologists (ESN) Symposium 28 August-1 September 2016; Braga, Portugal.
Persson T. 1989. Role of soil animals in C and N mineralization. Plant Soil, 115: 241-245. doi:10.1007/BF02202592 ![]()
Powers S.E., Nambi I.M., Curry G.W. 1998. Non-aqueous phase liquid dissolution in heterogeneous systems: Mechanisms and a local equilibrium modeling approach. Water Resour. Res., 34: 3293-3302. doi:10.1029/98WR02471 ![]()
Rhoades C. 1997. Single-tree influences on soil properties in agroforestry: lessons from natural forest and savanna ecosystems. Agroforest. Syst., 35: 71-94. doi:10.1007/BF02345330 ![]()
Rowell D.L. 1994. Soil science: Methods and applications. London: Longman Group UK Ltd.
Saetre P., Baath E. 2000. Spatial variation and patterns of soil microbial community structure in a mixed spruce-birch stand. Soil Biol. Biochem., 32: 909-917. doi:10.1016/S0038-0717(99)00215-1 ![]()
Seeber J., Langel R., Meyer E., Traugott M. 2009. Dwarf shrub litter as a food source for macro-decomposers in alpine pastureland. Appl. Soil Ecol., 41: 178-184. doi:10.1016/j.apsoil.2008.10.006 ![]()
Seeber J., Seeber G.U.H., Langel R., Scheu S., Meyer E. 2008. The effect of macro-invertebrates and plant litter of different quality on the release of N from litter to plant on alpine pastureland. Biol. Fertil. Soils, 44: 783-790. doi:10.1007/s00374-008-0282-6 ![]()
Shinoda Y., Akasaka M. 2017. Incorporating habitats of plants and ungulates contributes to prioritize targets for conserving regional plant diversity. Ecosphere, 8: e01713. doi:10.1002/ecs2.1713 ![]()
Steffens M., Kolbl A., Totsche K.U., Kogel-Knabner I. 2008. Grazing effects on soil chemical and physical properties in a semiarid steppe of Inner Mongolia (PR China). Geoderma, 143: 63-72. doi:10.1016/j.geoderma.2007.09.004 ![]()
Su Y.Z., Li Y.L., Cui H.Y., Zhao W.Z. 2005. Influences of continuous grazing and livestock exclusion on soil properties in a degraded sandy grassland, Inner Mongolia, northern China. Catena, 59: 267-278. doi:10.1016/j.catena.2004.09.001 ![]()
Sylvain Z.A., Wall D.H., Cherwin K.L., Peters D.P.C., Reichmann L.G., Sala O.E. 2014. Soil animal responses to moisture availability are largely scale, not ecosystem dependent: insight from a cross-site study. Global Change Biol., 20: 2631-2643. doi:10.1111/gcb.12522 ![]()
Teague W.R., Dowhower S.L., Baker S.A., Haile N., DeLaune P.B., Conover D.M. 2011. Grazing management impacts on vegetation, soil biota and soil chemical, physical and hydrological properties in tall grass prairie. Agric. Ecosyst. Environ., 141: 310-322. doi:10.1016/j.agee.2011.03.009 ![]()
Winchester N.N., Behan-Pelletier V., Ring R.A. 1999. Arboreal specificity, diversity and abundance of canopy-dwelling oribatid mites (Acari : Oribatida). Pedobiologia, 43: 391-400.
Winchester N.N., Behan-Pelletier V.M. 2003. Fauna of suspended soils in an Ongokea gore tree in Gabon. In: Basset Y., Novotny V., Miller S.E., et al., (Eds). Arthropods of tropical forests: Spatio-temporal dynamics and resource use in the canopy. Cambridge: Cambridge University Press. pp. 102-109.
acarologia_4308_supplementary.pdf


2018-05-15
Date accepted:
2018-12-10
Date published:
2019-01-18
Edited by:
Roy, Lise

This work is licensed under a Creative Commons Attribution 4.0 International License
2019 Liu, Rentao; Meller, Roy and Steinberger, Yosef
 Download article
Download the citation
RIS with abstract
(Zotero, Endnote, Reference Manager, ProCite, RefWorks, Mendeley)
RIS without abstract
BIB
(Zotero, BibTeX)
TXT
(PubMed, Txt)